Sunset view of Clark Range from Horizon Ridge. Photo credit © Dong Fang.
The Evolution Of Management Science To Inform Carrying Capacity Of Overnight Visitor Use In The Yosemite Wilderness
Stewardship
August 2021 | Volume 27, Number 2
Exploration, whether physical or contemplative, and the freedom and solitude associated with being in the backcountry underlie high-quality wilderness dependent recreational experiences (Sax 1980). To avert overcrowding, mitigate biophysical impacts, and ensure quality wilderness experiences, managers utilize a suite of management tools, including inventories and assessments of wilderness campsite and social conditions, to evaluate changes to use and condition over time. Managers may then make necessary changes to maintain wilderness character and avoid resource impairment.
Yosemite National Park (hereafter the Park) has attempted to manage social and experiential impacts through travel zone capacities and a system of trailhead quotas linked to the zones (van Wagtendonk 1986, van Wagtendonk and Coho 1986). Between 1974 (when permit restrictions were first implemented) and 1979, wilderness use averaged 188,000 use nights annually in 1975, annual visitation for overnight wilderness use peaked with 218,890 use nights (van Wagtendonk 1979, van Wagtendonk 2003b). Between 1980 and 2007 annual overnight visitation into the wilderness averaged 107,500 use nights per year. However, since 2008 this average has increased to 161,000 overnight visitor use nights per year (National Park Service 2020) (Figure 1). And there has been even more of a resurgence in visitation with the record peak of 1975 nearly reached again in 2016 with 216,989 overnight wilderness use nights during the National Park System Centennial.
Although zoning and trailhead quotas have largely been able to mitigate biophysical and experiential impacts of overnight visitation, several factors have recently emerged which have led to the persistence of hotspots. The John Muir Trail (JMT) and Pacific Crest Trail (PCT) have risen in popularity, and this increase in overnight visitors entering from outside the Park’s permit system has posed challenges for managers associated with both interagency coordination of permits and compliance with permit regulations (Reigner and Wimpey 2020). And, the advent of geospatial technology and social media have likely further exacerbated hotspots of overuse as visitors can now more easily share their favorite locations with notes on amenities, and exchange tips about connecting trails and campsites.
In this article, we will describe the visitor use management approaches originally developed that continue to be used in Yosemite National Park for the Yosemite Wilderness. We discuss the historic evolution of visitor use when the permit system was first conceived and when early computer systems were used to project use limits by trailhead and by zone to arrive at thresholds for overnight visitation. We also discuss the evaluation of the effectiveness of the program through visitor surveys, monitoring programs to assess campsite level impacts, and studies that have assessed changes in the spatial and temporal aspects of travel patterns. Lastly, we discuss the relationship between increased use from outside the Park, hotspots, and campsite selection, and conclude with some brief considerations of future trends and potential management solutions.
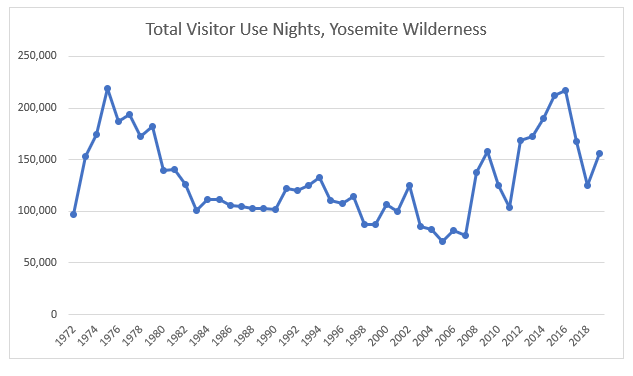
Figure 1 – Annual visitor use nights in Yosemite Wilderness (van Wagtendonk 1981): 1972-1979, (National Park Service 2020): 1980-2019.
Wilderness experience and carrying capacity
Much of the early social science that informed wilderness carrying capacity was developed by biologists who studied biophysical impacts (Cole 2019). This included Lowell Sumner who reported on the degradation of mountain meadows caused by recreational pack stock use in Yosemite and Sequoia National Parks. His studies led him to what we now consider the first articulation of the recreational carrying capacity concept; he warned about exceeding the “recreational saturation point” in the parks (Sumner 1938).
In 1959, Al Wagar was hired as the Forest Service’s first recreation researcher to study both the experiential and biophysical impacts of wilderness visitation. Among the ideas that came from his work were that carrying capacity was not an inherent, a priori property of a place or an absolute value, rather it depended on the needs and values of people and therefore could only be defined in relation to some management objective (Wagar 1964). That is, instead of a pre-ordained level set by fiat or a prescriptive policy mandate, recreational carrying capacity was seen as a conflict between the quality of experience and quantity of visitors, the discordance of which Wagar believed could be reduced through management actions such as zoning, engineering, persuasion, and intervention to sustain biotic communities (Cole 2001).
The ultimate implication of these concepts has been to reconcile visitors’ opportunities for solitude and primitive and unconfined experiences with the collective travel patterns of users on a given day while attempting to limit resource impairment and experiential impacts particularly as the two coalesce to form hotspots of visitor overuse. That is, how can managers balance a high demand for popular destinations accessed from trailheads that are typically at full capacity and protect against recreational impacts? Paradoxically, for one to achieve the desired experiential condition of solitude one must necessarily know the more commonly trafficked areas and permanent points of visitation in order to avoid them. Herein lies the challenge of navigating a solitary wilderness experience amid relatively dense visitation: how to be “alone with others” (Lee 1977), if indeed that is what one is seeking from the outset.
From traditional wilderness users to growth in overnight backpacking
Wilderness use in Yosemite before the mid-1960s was characterized by a relatively low number of visitors and a high level of impact per visitor. Stock use was the dominant mode of wilderness travel during these years. The first Sierra Club High Trip in the Sierra Nevada was undertaken in 1901; each “High Tripper” was allowed to bring a dunnage bag of up to 40 pounds of personal effects to be packed in by mule, including such items as musical instruments and tripod cameras (Turner 1993). These large parties also relied on heavy iron cooking equipment, among other “essentials”. The trips continued well into the 1940s; they were intended to build a constituency of “conservation warriors”, however, the level of amenities were nothing short of luxurious, and with the large size of groups led to acute biophysical impacts to fragile alpine lakes and meadow systems (Cohen 1988). So too, were these trips impactful to the experience of other backcountry wilderness users who were displeased upon coming into contact with the “horde”. The Sierra Club went to great lengths to defend its methods of packing equipment and people in on trips and attributed the damage being done in meadows to others (Sumner and Leonard 1947), however, there were still direct impacts from grazing associated with stock use.
The impacts of stock use weren’t just limited to Sierra Club outings. Materials and supplies packed in by stock were used to construct structures associated with semi-permanent wilderness camps, including backcountry outhouses and camp furniture (Ernst 1949; Sharsmith 1961; Briggs 1966). Traditional users took pride in the self-reliance of “woodcraft”; they established long term camps in wilderness areas by cutting branches to make lean-tos, pine bough beds, fireplaces, and other semi-permanent encampment features (Turner 2002).
This form of wilderness recreation associated with long term camps where traditional, more primitive living skills were practiced was inherently more impactful than backpacking as it is practiced today with transient daily movement and the packing in and out of gear and food (Turner 2002). In backcountry areas nationwide, these long-term camps and the economic experience of recreational hunting and fishing associated with them were eventually seen as an unacceptable impact to wilderness character (Fincher 2012).
Following a surge in wilderness visitation in the late 1960s and early 1970s, park personnel started tracking use based on voluntary campfire permits and then mandatory use permits. Wilderness permits were first used in the national forests and parks in the Sierra Nevada of California in 1971 and began to be used compulsorily in the Park in 1972, though limits to use and permit enforcement would be introduced in subsequent years (Elsner 1972). Concurrently, Holmes et al. (1972) conducted an inventory of 800 miles (1,287 km) of trails and over 7,000 camping locations in the Yosemite backcountry for human-caused impacts (Fig. 2). Campsite surveyors found hundreds of campsites around popular lakes, trampled vegetation in heavily used areas, and eroded and multiple trails throughout the proposed wilderness. It was not uncommon to find more than 200 people concentrated around fragile alpine lakes and small subalpine valleys near water sources at one time (van Wagtendonk and Benedict 1980b).
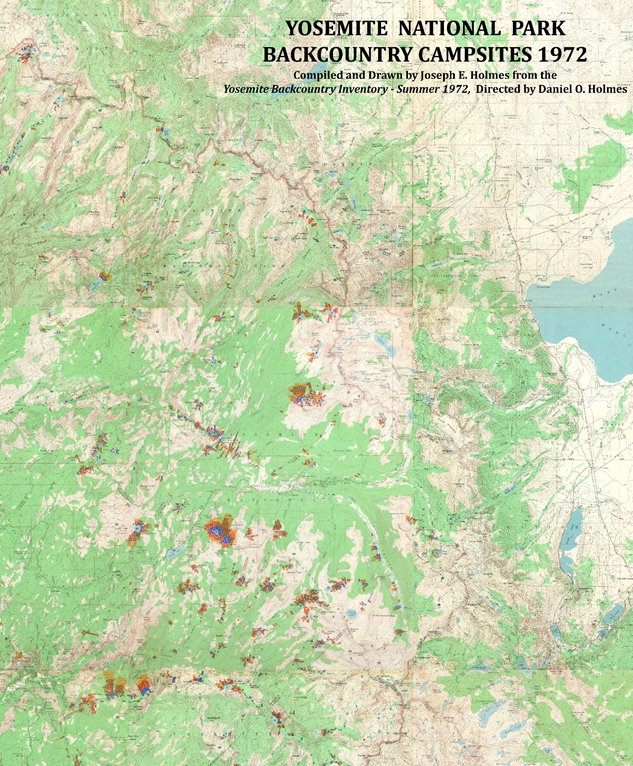
Figure 2 – Yosemite National Park Backcountry Campsites, 1972 – Compiled and drawn by Joseph E. Holmes from the Yosemite Backcountry Inventory – Summer 1972, Directed by Daniel O. Holmes (Subset of original extent with Cathedral Lakes at center).
Guided by the results of the survey, Parmeter (1976) conducted studies of biophysical parameters such as vegetation, soil, water, and microclimate impacts. Experiments were also conducted to quantify the direct impacts of trampling and urine (Holmes 1979). These biophysical studies concluded that although impacts increased as use increased, the relationship between use and impacts was influenced by many other factors and that the determination of acceptable impacts was a subjective decision (van Wagtendonk 2003a). Social impact studies were conducted to determine the relationship between use levels and the wilderness experience. Lee (1977) and Absher and Lee (1981) interviewed visitors about their attitudes toward crowding, resource impacts, and satisfaction, and concluded that there was no correlation between avoidance behavior and perceived crowding, instead they found that human behavior and resource condition were determinants of satisfaction. These initial wilderness studies in tandem with travel pattern models would help to catalyze the management response over the succeeding years.
Developing a quota system and assessing permit effectiveness
Modelling use levels and travel patterns
The Wilderness Simulation Model (WSM) was a simulation program written by Heck and Webster (1973) that ran on a mainframe computer. Smith and Krutilla (1976) refined the model based on Stankey’s (1972) hypothesis that visitors’ satisfaction with a wilderness experience was inversely related to the number of encounters they had with members of other parties. While this early hypothesis is now thought to be an oversimplification, it nevertheless was a useful starting point. Fisher and Krutilla (1972) conceptualized this idea into a model that established the optimum level of use in a wilderness area to be the point at which the incremental benefit of an additional party is just offset by the decrease in the benefits of the parties encountered.
Prototype testing of the WSM was conducted on the Spanish Peaks Primitive Area (Smith and Krutilla 1976) and the Adirondack Forest Reserve (Smith and Headly 1975). Subsequently, the model was enhanced by Resources for the Future under contract with the U.S. Forest Service (Shechter 1975). This new WSM model was applied to the Desolation Wilderness in California (Shechter and Lucas 1978) and the complex of wilderness areas surrounding Yosemite National Park (van Wagtendonk 1979). Simultaneous with the effort to apply the WSM to the Desolation Wilderness, scientists and managers at Yosemite began assembling the necessary information to run the WSM (van Wagtendonk 1979).
Visitor data required to run the WSM included a mix of weekly, daily, and hourly distributions of use; party-size distributions; and mode of travel. For example, small parties on horseback were distinguished from large hiking parties. Area information included the trail segments and campsites in the network and the time it took parties of different sizes to hike or ride each trail segment in each direction. A study was conducted in Yosemite to determine trail travel times for parties on 1-mile (1.6 km) trail segments as input to the WSM (van Wagtendonk and Benedict 1980a). Surveyors timed backpacking parties, day-hiking parties, and horse-riding parties to travel all the sample trail segments of different slopes and directions. Party size was not significant for all three types of parties, and slope-direction class was significant only for backpacking parties. In the WSM, the various routes that might be taken were enumerated along with their probability of being selected. The output from the WSM included numerous tables showing encounters by party type, location, trip length, and total use level across zones (van Wagtendonk 2003b).
There are 55 trailheads with 695 miles (1,112 km) of trail and 375 camping areas identified for simulation in the Yosemite Wilderness (Fig. 3). Additionally, 46 trailheads feed 416 miles (666 km) of trail and 197 campsites on Forest Service wilderness areas adjacent to the Park (van Wagtendonk 2003b). These geographic parameters were used to arrive at the trailhead quotas, which were originally calculated in 1977 with the 20,000 permits issued in 1973. These permits were used because travel behavior that year was not yet limited and thus provided a baseline for unrestricted travel that maximized freedom of movement. For the four years before implementing trailhead quotas in Yosemite, wilderness use was rationed by travel-zone limits. The capacities of the original travel zones were derived from a social density factor, the acreage of the zone, the number of miles of trail in the zone, and a reduction factor for ecological fragility based on vegetation (van Wagtendonk 1986). Trailhead quotas have subsequently been reassessed and modified over the years to arrive at the current trailhead quotas.
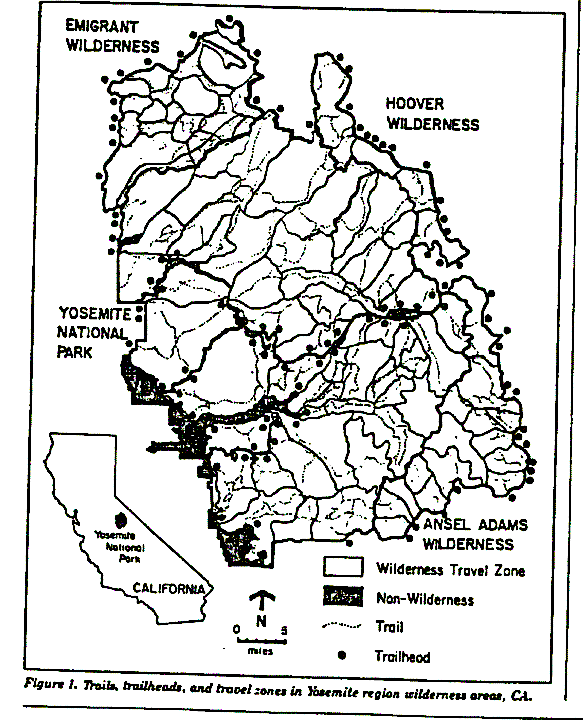
Figure 3 – Original trails, trailheads, and travel zones with adjoining national forest wilderness areas (van Wagtendonk and Coho, 1986).
Backcountry surveys and campsite monitoring to assess permit system effectiveness
Permits, which include information on group size, trailhead, and itinerary, among other data, can determine use and allow all recorded routes to be simulated to determine and update zone-based carrying capacities rather than just a sample of possible routes (van Wagtendonk 2003b). However, there are some problems with basing management decisions solely on data from permits, and thus a need to survey wilderness users exists to determine permit compliance and the validity of the system. That is, even though permits have been made readily available to visitors, some do not always obtain them, and parties that obtained permits can deviate from their anticipated trips. Additionally, not all permit holders contain their trip within the Park. In the 1970s, eight percent of the use reported on Yosemite’s permits traveled into Forest Service zones, while four percent of Yosemite’s use originated from Forest Service permits. This challenge was dealt with by assigning unique zone numbers to each agency’s wilderness areas and exchanging permit data at the end of the year (van Wagtendonk 1981).
Use limits set by analysis of permit information were gaining favor as a useful data source and the preferred management action to address wilderness hotspots for Park Service wilderness programs (van Wagtendonk and Parsons 1996). This included other early work throughout the Sierra Nevada, such as that by Parsons et al. (1981) who hand-tallied wilderness permits to derive quotas for nine camp areas reached by three trailheads in the Mineral King area of Sequoia National Park.
To assess actual versus permitted overnight wilderness use and alterations to travel plans, uniformed personnel interviewed backpackers exiting the four most popular trailheads in the Yosemite Wilderness over a random selection of four days during each of the first three weeks of August in 1976, 1977, and 1978 (van Wagtendonk and Benedict 1980b). Researchers found 91.9 percent of those surveyed over the three years had permits, accounting for 94.7 of the party nights. Sixty-two percent of parties with permits made changes to their trip, and they tended to shorten their trip both in terms of time and distance. The overall result was a decrease in time spent in outlying areas further away from trailheads as parties abandoned their itineraries to spend extra time in areas nearer to trailheads, thus concentrating visitor nights and campsite impacts in zones closer to trailheads (van Wagtendonk and Benedict 1980b).
A rationing system should reduce crowding by influencing the temporal and spatial distribution of use. The use limits proved to be effective in shifting use from peak summer months to earlier in the season (May and June) and from heavily used travel zones without reducing overall visitation (van Wagtendonk 1981). Use of the four most popular trailheads went from 68 percent of total use in 1973 to 57 percent of total use in 1983 as quotas went into effect and visitors utilized alternative trailheads (van Wagtendonk and Coho 1986).
Managers were concerned that heavily used zones, usually a day’s hike from the trailheads would act as bottlenecks, leaving more distant zones below capacity. To resolve bottlenecks, by choosing an alternate trailhead leading to the same zone as the trailhead that had been denied them. Records were kept of visitors’ first and second choice trailheads (van Wagtendonk and Coho 1986). Out of a sample of 490 parties, 60 percent chose to go to a different zone. Parties who chose a trailhead that led to the same zone made up 21 percent of the total, while an additional 18 percent opted to wait a day for their first choice.
In the mid-1980s a comprehensive wilderness campsite survey was completed in Yosemite. The Wilderness Impacts Monitoring System (WIMS) recorded 5,547 campsites and 1,048 miles (1,687 km) of trail across the Yosemite Wilderness (Sydoriak 1986). WIMS used a slightly modified version of the system developed by Parsons and McLeod (1986) in Sequoia and Kings Canyon National Parks. WIMS measured eleven impact criteria: firewood availability, tree root exposure, visual obtrusiveness, vegetation density, vegetation composition, total campsite area, barren core, litter and duff, campsite developments, mutilations, and social trails. As a result, the first systematic wilderness campsite restoration efforts were started in the late 1980s.
In the mid-1990s, wilderness rangers completed WIMS 2, a sample of 34 areas that encompassed 700 campsites in the wilderness (Boyers et al. 2000). During the WIMS 2 monitoring, numerous sites had no campsite structures remaining but still showed substantial vegetation damage. The WIMS 2 monitoring showed a large increase in the number of campsites that were barely discernible with small charcoal deposits with slight or loss of vegetation cover. The number of heavily developed campsites with large, heavily used rings, and litter and duff completely absent with extensive bare soil and vegetation loss were reduced in number. Sites that are removed most often don’t meet permit conditions; an assessment of campsites showed that out of 30 sites removed, 70 percent were either within 100 feet of the trail or 100 feet of water (Lawson and Newman 2001).
WIMS 3 was conducted in the mid-2000s, monitoring the same sample areas as WIMS 2, and adding additional variables to try to better understand the effects of campsite restoration (Fincher 2008). For each of the 34 areas surveyed for WIMS 3, every campsite within the delineated area was assigned a condition class for structures, vegetation impacts, and distance to water. The effects of restoration efforts were obvious in that the overall number of campsites continued to decline, with a drop of 21 percent between WIMS 2 and WIMS 3. Distance to water was not recorded during the WIMS 2 surveys but was compared between WIMS and WIMS 3. There was a 58 percent reduction in sites within 25 feet of water during this timeframe and a 26 percent reduction in sites located 25 to 50 feet from water (Fincher 2008).
Changing use patterns and the proliferation of hotspots
Changing travel patterns
The trailhead quota system and dispersed camping regulations were instituted to retain maximum visitor freedom while limiting use to capacities that protect ecological and social values. That is, to ensure carrying capacity not be exceeded, visitors must make trade-offs between conflicting desires. Surveys of Yosemite Wilderness visitors have confirmed that the quality of freedom is an important part of the experience for which visitors are willing to make a trade-off; visitors have been willing to tolerate increases in certain forms of regulation (e.g., trailhead quota restrictions) to obtain a high-quality recreation experience (e.g. solitude) (van Wagtendonk and Coho 1986; Newman et al. 2005). Additionally, overnight users that have greater familiarity with wilderness tend to be more strongly opposed to requiring camping at designated campsites, constructing more trails to reduce encounters, and implementing amenities like pit toilets and backcountry bear boxes to accommodate group activity (Hall and Irizarry 2014). Importantly, trade-offs exist across a spectrum of interrelated conditions and preference thresholds. For instance, the number of groups encountered per day is absolute but perceived differently relative to an individual’s tolerance for crowding (Newman, Marion, and Cahill 2001), and this may differ by experience level or other factors. Furthermore, one’s acceptance of regulations may be relative to the ease of obtaining a first-choice permit from a desired trailhead, which is subject to overall demand although relative to one’s familiarity and expectations with how to navigate the permit system.
Spatial and temporal deviations from intended trip plans are a useful way to assess changing demand. Van Kirk et al. (2011, 2014) used 14,497 intended itineraries in the Yosemite Wilderness permit database to analyze and compare with actual itinerary information collected from surveys of 1,124 permit-holder respondents during the summer of 2010. The planned and actual trips were compared to evaluate trip deviation and reassess the relationship between zones and trailheads for potential redistribution of use (Van Kirk et al. 2011). Researchers developed an application to assess the travel route and trip duration for each party to dynamically simulate use according to a transition probability matrix. Each entry in the matrix was the conditional probability of a party spending its next night in each of the wilderness zones, given its current location. Temporal deviations arrived at from their intended itineraries comprised 36.2 percent of all parties, and 54.4 percent deviated spatially, while 25.2 percent of all parties deviated both spatially and temporally. These results are like those collected from 1976 to 1978 when 41.5 percent deviated temporally, 48.2 percent deviated spatially and 27.4 percent deviated both spatially and temporally (van Wagtendonk and Benedict, 1980b). The 2014 study also found a spatial deviation of groups from their planned first night’s zone and subsequent zones, indicating a path dependency once their trip was altered (Van Kirk et al. 2014). Predictors of deviation from intended itinerary included group deviation earlier in the season given snow displacement, larger groups less likely to deviate, and the largest influence being intended trip length, for each extra day of intended trip length, trips tended to be half a day shorter (Van Kirk et al. 2011). As a result, several wilderness zones were confirmed to be routinely overcapacity relative to use limits (see Figure 4 for more recent zone boundaries).
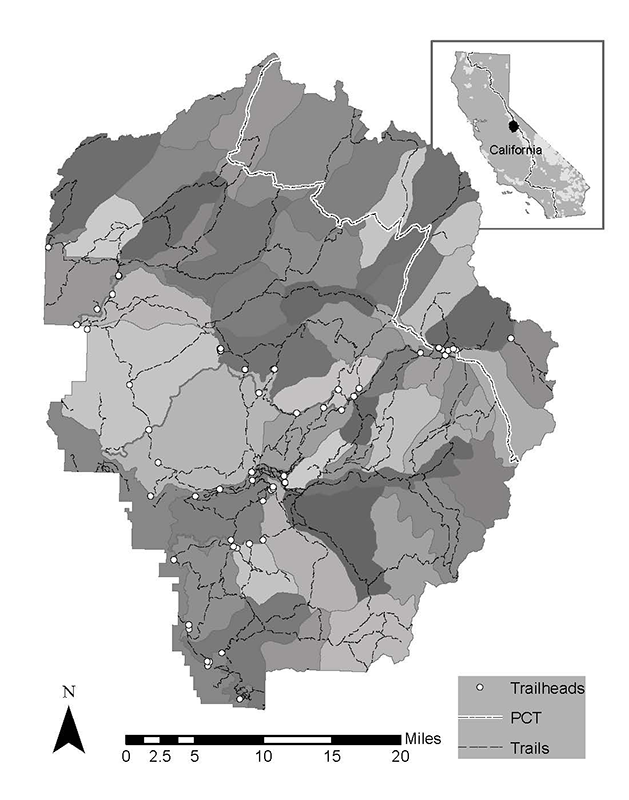
Figure 4 – Travel zones, trailheads, and trails (including PCT) of Yosemite Wilderness (Van Kirk et al. 2014).
A new vegetation map (Keeler-Wolf et al. 2012) and refined topographic and trails data made it possible to revise the adjusted zone limits in 2016 using a geographic information system. These revised zone limits are used for consideration of alternative travel scenarios and potential future adjustments to trailhead quotas. Additionally, a different method of “campable” area has been explored for the calculation of zone limits.
Inter-jurisdictional permit demand and overnight hotspots
The PCT and JMT have received increased levels of use in recent years. For instance, PCT long-distance permits issued increased from 6,027 in 2016 to 8,934 in 2019 (Reigner and Wimpey 2020). For a typical summer day, the Park receives at least 300 to 500 reservation requests, of which approximately 80 to 90 percent are for those beginning the JMT southbound from the Park. The Park has responded with a quota of 45 users per day exiting the Yosemite Wilderness on the JMT. However, this management action has resulted in permit requests being extended further into earlier and later shoulder seasons as the demand for permits still exists. There has also been an increase in northbound travel along the JMT as hikers seek permits from other agencies for travel that begins outside of the Park at other Forest Service trailheads and ultimately terminates in the Park.
Increased use of the JMT and overlapping portion of the PCT corridor, regardless of direction, has thus contributed to an increase in the overall number of overnight backpackers traveling through the Yosemite Wilderness, which has exacerbated hotspots of overuse. Furthermore, visitors who come from outside the Park with permits from other land units might have different expectations and behaviors than what permit regulations in Yosemite call for or they may simply be ignorant of the permit regulations altogether, which tend to be more restrictive than in other land units in the Sierra Nevada (e.g., use of bear canisters, campfire restrictions, prohibition of dogs). The different preferences of backpackers in these user groups and ultimately overnight visitors’ level of compliance with permit regulations might contribute to their campsite selection at hotspots.
Adverse conditions associated with wilderness hotspots include high population density, social trails, bare soil, firewood depletion, human waste, and fire ring proliferation. Criteria associated with the attractiveness of hotspots include immediate proximity to water, proximity to trailheads, proximity to the PCT-JMT corridor, and being a popular destination or natural stop area. Notably many of the hotspot areas in the Park today are the same areas as in the 1970s when campfire permit data were collected (see Figure 2), and this is a function of both the proximate features at each site like scenic vistas and access to water, as well as their location within the broader trail network where travel time, topography, mileage, and ability level facilitates similar patterns of movement between sites. One caveat to this is that some travel zones closer to trailheads are more in demand today than they were in the 1970s, which either indicates a preference for shorter travel or use of these zones and the hotspots they contain as first night “stepping stones” to subsequently arrive at popular destinations in zones already reserved to capacity (Van Kirk et al. 2014).
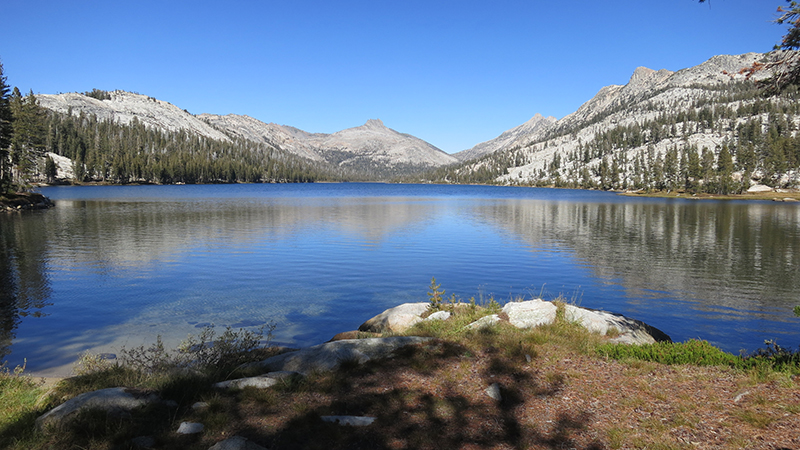
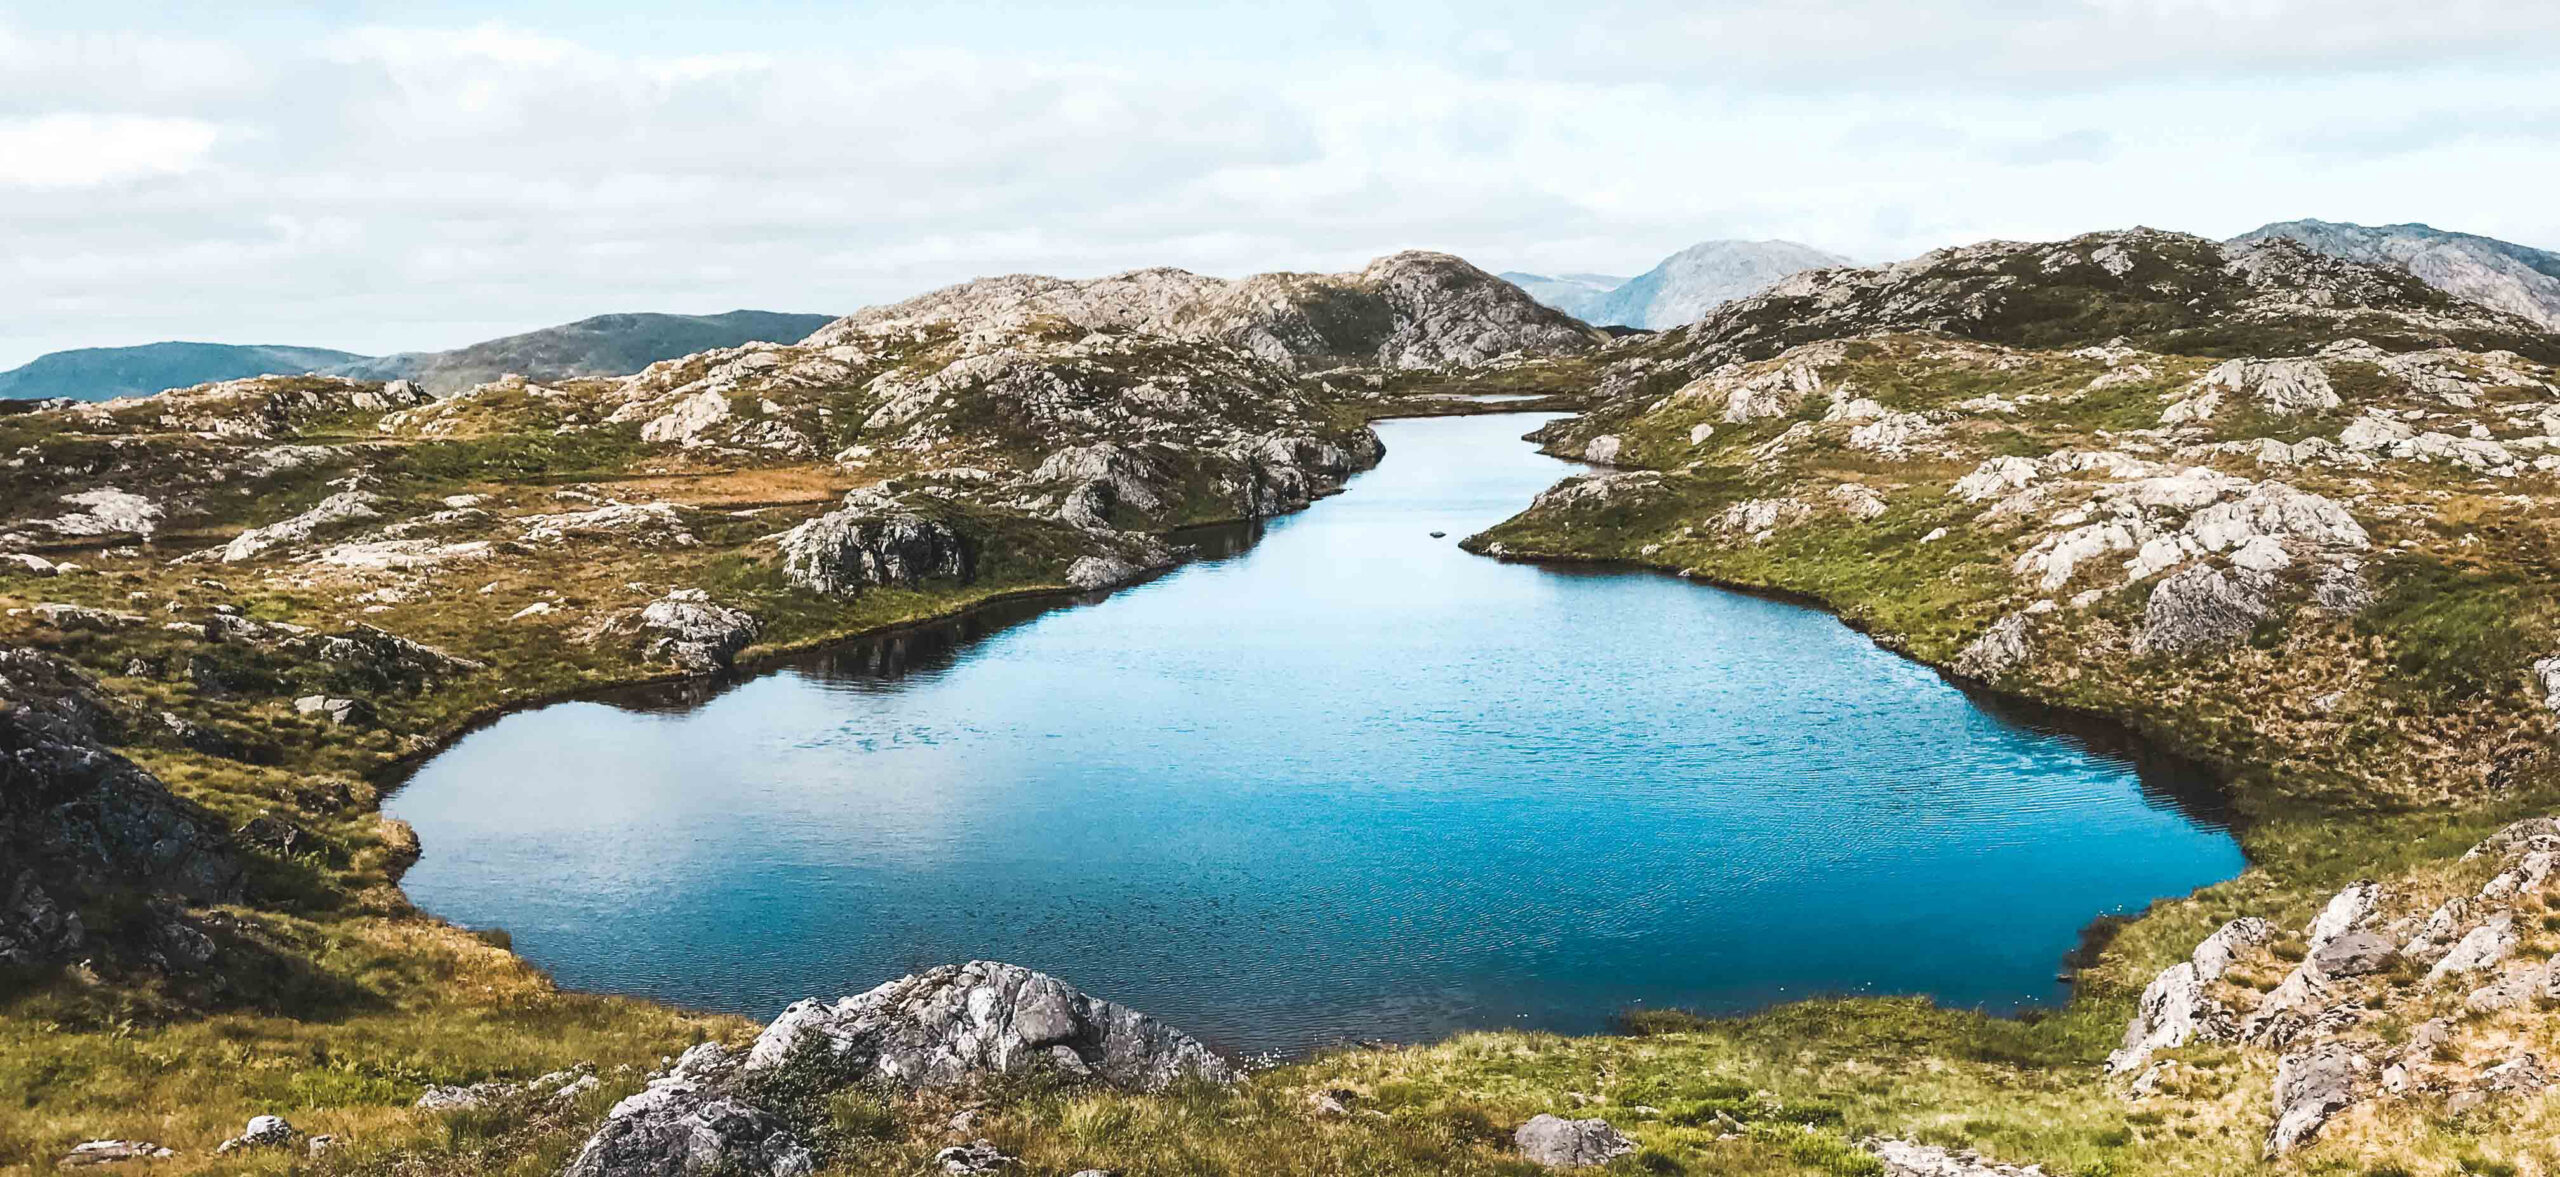
Figure 5 – Tilden Lake in the Yosemite Wilderness. Photo by Mark Fincher.
Aside from the preference for shorter trip lengths as well as technical innovations to gear that have made it lighter and more effective, perhaps the biggest change to wilderness use over the last several decades has been the increased use of geolocational devices for navigation, including dedicated GPS devices to simply an app on a phone (Martin 2017). While these technologies provide handy assistance to augment knowledge they are by no means a substitute for experience, especially with safety considerations (Martin and Pope 2012), nor do they always align with what is allowed by permit (e.g., an app or blog may suggest a camping location too near water or not far enough from the trailhead). Navigation technology along with the increased use of online information-sharing platforms (e.g., social media, trip maps, blogs) contribute to individual and group decision processes about permit, route, campsite, and overall trip selection, and are thus an important variable when considering both experiential and physical impacts to wilderness character (Carlson et al. 2016).
Visitors choose a campsite for many reasons, including, but not limited to vistas, a level sleeping area, amount of sun or protection from wind, privacy from other campers or proximity to the trail, seasonal factors like avoidance of snow cover and mosquitoes, and amenities like natural furniture and fire rings from previous use that may accommodate groups (Fincher 2008). Because of these different preferences, and in order to avoid proliferation of new camp sites footprints with their resultant biophysical impacts, the number of desirable campsites in an area should be substantially greater than the maximum number of groups expected at peak use, and management focus must consider those factors that make a site desirable or undesirable for visitors. Therefore, reductions in use might be considered for areas where the number of groups greatly exceeds the number of acceptable, sustainable campsites.
Conclusions
Trends of overnight visitation in the Yosemite Wilderness are anticipated to continue if left unaddressed by management actions, including the aggregation around hotspots and the related concentration of biophysical and experiential impacts. Hotspots that are in zones closer to trailheads and those high demand locations that are accessible by multiple trailheads will proliferate. Some level of gaming the system will no doubt persist despite whatever use limits, permit regulations, and other management strategies are put into place, including first night zone and pass-through requirements. Also, the use of social media for information sharing and further reliance on navigational technologies will contribute to continued use of hotspots as visitors base their pre-travel and in-situ overnight locational decisions on known destinations where others have previously noted camping areas with vistas and nearby water sources, among other amenities. This is also the case for those entering the park along the PCT-JMT corridor, whose campsite selection strategies are planned by the distance between food supply restocks. And it will now likely be more common under a changing climate regime to see greater deviation from the current timing and location of permitted overnight use given increased variability in the magnitude and timing of previously expected seasonal temperature and precipitation trends (Marshall et al. 2018). It is already the case that high snowpack years and wildland fires with their associated air quality conditions alter wilderness travel patterns, place further restrictions on permit regulations, or lead to seasonal closures of some destinations altogether.
Given that social and environmental drivers of change will continue to contribute to management complexity of overnight visitor use, we might ask: does the existing trailhead quota system still deliver desired experiences for backpacker groups and at the same time protect wilderness character?
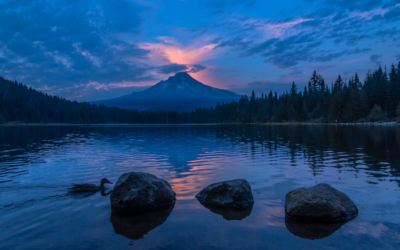
Figure 6 – Falls Creek in the Yosemite Wilderness. Photo by Mark Fincher.
Given that social and environmental drivers of change will continue to contribute to management complexity of overnight visitor use, we might ask: does the existing trailhead quota system still deliver desired experiences for backpacker groups and at the same time protect wilderness character? That is, what must be reassessed for the permit system to continue to function with the continued high demand and environmental variability expected in the foreseeable future? Several potential areas that the park should consider include implementing pass quotas to better control those visitors coming in from adjoining wilderness areas and conversely exit quotas, as well as better enforcement of first night zone quotas and potential greater use of pass-through requirements to distribute use (Fincher 2015). These potential solutions would address hotspots of overuse that result from external and internal travel pattern overlaps. Education and enforcement through permit regulations will also remain important regardless of total distribution of use to inform visitors and disincentivize deleterious behaviors. A replicable inventory of indicators from year-to-year will also remain important for the park to anticipate when thresholds impacts associated with use levels and travel overlap have been reached to avoid impairment. Key to this will be a mechanism for managers to adapt quota capacities to anticipated changes in resource conditions, though the challenge to all of this remains how to make this feasible given the expectations of visitors for reliable and understandable permit conditions, and perhaps most vexingly uncertain systemic environmental conditions, namely seasonal variability in the magnitude and timing of snowpack and wildland fire.
Acknowledgements
The lead author would like to thank Steve Martin and Jeremy Wimpey for their thoughtful feedback on earlier draft versions of this manuscript as well as Nathan Reigner for his earlier insights. Thanks also goes to the many National Park, Forest Service, and Pacific Crest Trail Association wilderness managers of the Sierra Nevada whose conversations have informed this review.
About the Authors
JEFFREY JENKINS is an Assistant Professor at University of California, Merced, Department of Management of Complex Systems; email:jeff.jenkins@ucmerced.edu
JAN VAN WAGTENDONK is Research Forester Emeritus, Yosemite National Park; email:jan_van_wagtendonk@partner.nps.gov
MARK FINCHER is the Wilderness Specialist, Yosemite National Park; email:mark_fincher@nps.gov
References
Absher, J. D., and R.G. Lee. 1981. Density as an incomplete cause of crowding in backcountry settings. Leisure Science 4(3): 231–248.
Boyers, L., M. Fincher, and J.W. van Wagtendonk. 2000. Twenty-eight years of wilderness campsite monitoring in Yosemite National Park. In: Cole, D. et al. Wilderness Science in a Time of Change Conference-Volume 5: Wilderness Ecosystems, Threats, and Management; 1999 May 23–27; Missoula, MT. Proceedings RMRS-P-15-VOL-5. Ogden, UT: U.S. Department of Agriculture, Forest Service, Rocky Mountain Research Station. p. 105-109.
Briggs, G.S. 1966. Yosemite National Park, A Report on Backcountry Conditions and Resources, with Management Recommendations. Yosemite National Park Research Library. 217 pages.
Carlson, T., J. Shultis, and J. van Horn. 2016. The use of new technology in wilderness: emerging issues and need for policy and management [White paper]. Society for Wilderness Stewardship.
Cohen, M. P. (1988). The history of the Sierra Club 1892-1970. Sierra Club, San Francisco.
Cole, D. N. 2001. Visitor use density and wilderness experiences: A historical review of research. In Visitor Use Density and Wilderness Experience Proceedings (pp. 11–20). Proceedings RMRS-P-20. Fort Collins, CO: USDA Forest Service, Rocky Mountain Research Station.
Cole, D. N. 2019. Community and Fire Ecologists, Park Biologists, and Recreation Scientists: The Antecedents of Wilderness Science. International Journal of Wilderness 25(3): 52-71.
Elsner, G.H. 1972. Wilderness management, a computerized system for summarizing permit information. USDA Forest Service General Technical Report PSW-2. 8 p.
Ernst, E.F. 1949. The 1948 Saddle and Pack Stock Grazing Situation of Yosemite National Park. 77 p.
Fincher, M. 2008. The Evolution of Campsite Impacts, Restoration, and Monitoring in the Yosemite Wilderness, 1972-2007 [White paper]. Yosemite National Park.
———. 2012. Humans apart from nature? Wilderness experience and the Wilderness Act. In: Cole, David N., Wilderness visitor experiences: Progress in research and management; 2011 April 4-7; Missoula, MT. RMRS-P-66.
———. 2015. Issue Statement: Capacity [White paper]. Yosemite National Park.
Fisher, A. C., and J. V. Krutilla. 1972. Determination of optimal capacity of resource-based recreation facilities. Natural Resources Journal 12(3): 417–444.
Hall, T., and S. Irizarry. 2014. 2013 Yosemite Wilderness visitor use study. Department of Conservation Social Sciences, University of Idaho. Report prepared for Yosemite National Park, May 2014.
Heck, N. A., and D. B. Webster. 1973. Wilderness Area Simulation Model: User’s Manual. Washington, D.C.: IBM and Resources for the Future. N. T. I. S. Accession No. PB-233 364/9/INW.
Holmes, D. O. 1979. Experiments on the effects of human urine and trampling on subalpine plants. In: Ittner, R; Potter, D. R.; Agee, J. K.; Anschell, S., eds. Recreational impact on wildlands. Conference proceedings; 1978 October 27–29; Seattle, WA. Proc. R-6-001. Portland, OR: U.S. Department of Agriculture, Forest Service; U.S. Department of the Interior, National Park Service: 79–88.
Holmes, D. O., S. Akeson, S.H. DeBenedetti, J.E. Holmes, M. Paine, A.Z. Parker, and T.F. Such. 1972. Yosemite backcountry inventory, summer 1972. Unpublished report on file at: U.S. Department of the Interior, National Park Service, Yosemite National Park, El Portal, CA. 2,295 p.
Keeler-Wolf, T., P. E. Moore, E. T. Reyes, J. M. Menke, D. N. Johnson, and D. L. Karavidas. 2012. Yosemite National Park vegetation classification and mapping project report. National Park Service Natural Resources Technical Report NPS/YOSE/NRTR-2012/598. National Park Service, Natural Resource Stewardship and Science Directorate, Fort Collins, Colorado, USA.
Lawson, S. R., and P. Newman. 2001. A spatial analysis of wilderness campsites in Lyell Canyon, Yosemite National Park. In: Kyle, Gerard, comp., ed. 2001. Proceedings of the 2000 Northeastern Recreation Research Symposium. Gen. Tech. Rep. NE-276. Newtown Square, PA: US Department of Agriculture, Forest Service, Northeastern Research Station. 245-248 (Vol. 276).
Lee, R.G. 1977. Alone with others: The paradox of privacy in wilderness. Leisure Sciences 1(1): 3-20.
Martin, S. 2017. Real and potential influences of information technology on outdoor recreation and wilderness experiences and management. Journal of Park and Recreation Administration 35(1): 98-101.
Martin, S. R., and K. Pope. 2012. The influence of hand-held information and communication technology on visitor perceptions of risk and risk-related behavior. In: Cole, David N., comp. Wilderness visitor experiences: Progress in research and management; 2011 April 4-7; Missoula, MT. Proc. RMRS-P-66. Fort Collins, CO: US Department of Agriculture, Forest Service, Rocky Mountain Research Station 66, p. 119-126.
Marshall, A., V. Butsic, and J. Harte. 2018. The Phenology of Wilderness Use: Backcountry Recreation in a Changing Climate. Weather, Climate, and Society 10(2): 209-223.
National Park Service. 2020. National Park Service Visitor Use Statistics. Park Reports: Yosemite. https://irma.nps.gov/STATS/Reports/Park/YOSE (Accessed July 10, 2020).
Newman, P., J. L. Marion, Jand K. Cahill. 2001. Integrating resource, social, and managerial indicators of quality into carrying capacity decision-making. The George Wright Forum 18(3): 28-40.
Newman, P., R. Manning, D. Dennis, and W. McKonly. 2005. Informing Carrying Capacity Decision Making in Yosemite National Park, USA Using Stated Choice Modeling. Journal of Park & Recreation Administration 23(1).
Parmeter, J.R. 1976. Ecological carrying capacity research: Yosemite National Park. 4 Vol. Available from: National Training Information Service, Springfield, VA 22161. PB270954AS.
Parsons, D.J., and S.A. McLeod. 1980. Measuring impacts of wilderness use. Parks 5(3): 8-12.
Parsons, D.J., T.J. Stohlgren, and P.A. Fodor. 1981 Establishing backcountry use quotas: an example from Mineral King, California. Environmental Management 5:335-40.
Reigner, N., and J. Wimpey. 2020. Multi-jurisdictional collaborative management of the Pacific Crest, National Scenic, and John Muir Trails. International Journal of Wilderness 26(2): 36-47.
Sax, J. L. 1980. Mountains without handrails: Reflections on the national parks. University of Michigan Press.
Shechter, M. 1975. Simulation Model of Wilderness-Area Use: User’s Manual and Program Documentation. Washington, D.C.: Resources for the Future. N. T. I. S. Accession No. PB-251 635/9/INW.
Shechter, M., and R. C. Lucas. 1978. Simulation of Recreational Use for Park and Wilderness Management. Baltimore, Md.: Johns Hopkins University Press.
Sharsmith, C.W. 1961. Report on the Status, Changes and Comparative Ecology of Selected Backcountry Areas in Yosemite National Park that Receive Heavy Use. Unpublished Report. 120 p.
Smith, V. K., and R. L. Headly. 1975. The use of computer simulation models in wilderness management: A case study of the Adirondack Forest Reserve. In S. Ladany, ed., Management Science Applications to Leisure Time. Amsterdam: North-Holland Publications.
Smith, V. K., and J. V. Krutilla. 1976. Structure and properties of a wilderness travel simulator: an application to the Spanish Peaks Area. Baltimore, Md.: Johns Hopkins University Press.
Stankey, G. H. 1972. A strategy for the definition and management of wilderness quality. In J. V. Krutilla, ed., Natural Environments: Studies in Theoretical and Applied Analysis. Baltimore, Md.: Johns Hopkins University Press, 88–114.
Sumner, L. 1938. Losing the Wilderness Which We Set Out to Preserve in p. 105 of Sellars, R. W. 1997. Preserving Nature in the National Parks: A History. New Haven, CT: Yale University Press.
Sumner, L., and Leonard, R. M. 1947. Protecting mountain meadows. Sierra Club Bulletin 32(5): 53-62.
Sydoriak, C. A. 1986. Yosemite wilderness trail and campsite impact monitoring system. USDI, National. Park Service, Yosemite National. Park, CA. 25 p.
Turner, T. 1993. Sierra Club: 100 years of protecting nature. Abradale Press.
Turner, J. M. 2002. From Woodcraft to ‘Leave No Trace’: Wilderness, consumerism, and environmentalism in twentieth-century America. Environmental History 7(3): 462-484.
Van Kirk, R., S. Martin, K. Ross, and M. Douglas. 2011. Simulation modeling and analysis of overnight visitor use of the Yosemite Wilderness. Final Report to the National Park Service, Yosemite National Park, El Portal, California
———. 2014. Computer simulation modeling to determine trailhead quotas for overnight wilderness use. Journal of Park and Recreation Management 32(3): 29-48.
van Wagtendonk, J.W. 1979. A conceptual backcountry carrying capacity model. In First Conference on Scientific Research in National Parks. American Institute of Biological Sciences and the National Park Service, US Dept. of the Interior. Abstract p. I (Vol. 18).
———. 1981. The effect of use limits on backcountry visitation trends in Yosemite National Park. Leisure Sciences 4(3): 311–323.
———. 1986. The determination of carrying capacities for the Yosemite Wilderness. (INT-212), 456-461.
———. 2003a. Role of Science in Sustainable Management of Yosemite Wilderness. Seventh World Wilderness Congress Symposium; 2001 Nov. 2–8; Port Elizabeth, South Africa, 6.
———. 2003b. The Wilderness Simulation Model. A Historical Perspective International Journal of Wilderness 9(2): 9-13.
van Wagtendonk, J.W., and J.M. Benedict. 1980a. Travel time variation on backcountry trails. Journal of Leisure Research 12(2): 99-106.
———. 1980b. Wilderness Permit Compliance and Validity. Journal of Forestry 78(7): 399–401.
van Wagtendonk, J.W., and P.R. Coho. 1986. Trailhead quotas. Rationing use to keep wilderness wild. Journal of Forestry 84(11): 22-24.
van Wagtendonk, J. W., and Parsons, D. J. 1996. Wilderness research and management in the Sierra Nevada National Parks. Science and ecosystem management in the National Parks. The University of Arizona Press, Tucson, AZ, 281-294.
Wagar, J.A. 1964. The Carrying Capacity of Wildlands for Recreation. Forest Science Monograph 7. Washington, DC: Society of American Foresters.
Read Next

Ambition: The Power of a Big Idea and Sticking to it
Protecting Half of Earth’s land and seas requires the power of persistence, truth and relationships.
Preserving the Wildness of Wilderness in the Anthropocene
Wildness: What is this evocative and elusive, primal and unquantifiable quality of Wilderness? Why is it so threatened in the non-analogue future we face? Why and how should we perpetuate it?
Crowding Perceptions at Wilderness Areas on Mount Baker, Washington and Mount Hood, Oregon
Investigating the population of recreational mountaineers on two Cascade peaks to gain a better understanding of who the climbers are and to investigate the perceived crowding levels.