A sleeping volcano Mt Hood at sunset, appeared to be erupting not with lava but
fiery orange cloud pattern. Photo credit © NOAA on Unsplash.
Crowding Perceptions at Wilderness Areas on Mount Baker, Washington and Mount Hood, Oregon
Science & Research
August 2021 | Volume 27, Number 2
PEER REVIEWED
ABSTRACT
The purpose of this study was to investigate the population of recreational mountaineers on two Cascade peaks- Mt. Hood, Oregon and Mt. Baker, Washington, situated in the US Pacific Northwest. Detailed information about the climbers’ socio-demographic information, trip characteristics, and group composition was identified to gain a better understanding of who the climbers are and to investigate the perceived crowding levels amongst segmented groups. A quantitative mixed method survey was utilized consisting of onsite interviews, mail-back surveys, and online surveys. Overall, perceived crowding was found to be at low or acceptable levels on both peaks. In addition, younger and beginner climbers reported higher levels of perceived crowding. Results are valuable in understanding the critical variable of crowding as it relates to the visitor experience.
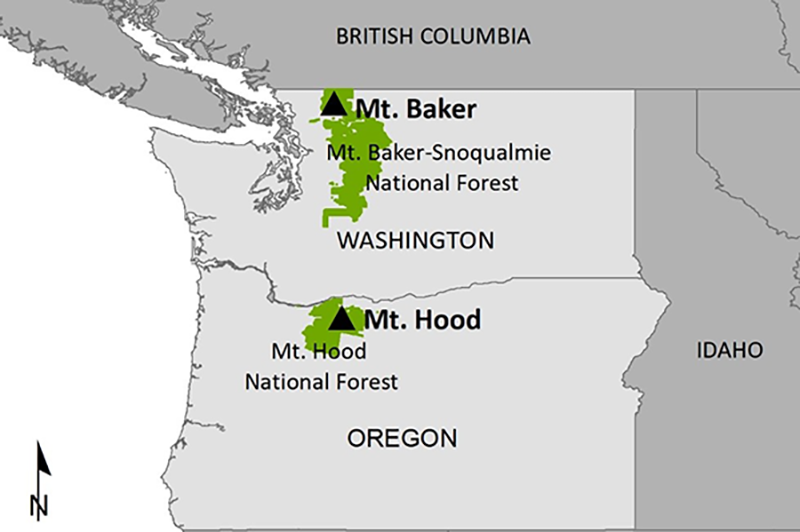
Figure 1 – Map of Mt. Hood, Oregon, and Mt. Baker, Washington (map credit: Jacquelyn Strager)
Figure 1 – Map of Mt. Hood, Oregon, and Mt. Baker, Washington (map credit: Jacquelyn Strager)
The carrying capacity framework has been applied to both the natural and social sciences. In the context of outdoor recreation, carrying capacity is “the level of recreational use an area can withstand while providing a sustained quality of recreation (Wagar 1964, p.3).” This approach to carrying capacity is like natural science applications except it also considers human social values as a critical component in determining the car- rying capacity of an area. As more people visit a recreation area, there is an increase in the potential for deterioration in both the quality of the natural resource and the overall recreational experience (Wagar 1964). Thus, social carrying capacity in recreational areas depends on both human and biophysical dimensions.
Social Carrying Capacity
Previous literature suggests that there are three dimensions of carrying capacity- resource, experiential, and managerial (Lime & Stankey 1971; Manning 2007). According to Lime and Stankey, recreation areas should be managed for a wide range of activities, uses, and values. When management is trying to determine the carrying capacity for their recreation area, the entire area should be considered so that an equal amount of activity variety is dispersed (Wagar 1974). However, since human values are often subjective, determining the carrying capacity of a park or similar area can be an ambiguous process. One of the challenges to social carrying capacity is determining the amount of impact allowable to the three dimensions of carrying capacity (Manning, 2001). People have social standards for the types of recreation experiences they desire. An example of a social standard is the number of groups encountered per day (Shelby & Heberlein 1986), or in the case of this study, the number of other climbers on the summit of a mountain.
Carrying capacity of a recreational area can also be measured by identifying indicators and thresholds of quality. Indicators are specific measurable variables that reflect the essence or meaning of management objectives (Manning 2001). In addition to being specific, indicators should be objective, manageable, reliable, repeatable, related to visitor use, and time sensitive (Manning 2001; 2007). Some examples of indicators of quality could be percentage of ground cover at a campsite, amount of braiding and erosion on a trail, and the number of other groups seen in a wilder- ness area (Manning 2009). Thresholds are minimally acceptable conditions associated with each indicator (IVUMC 2019). Thresholds of quality can be established through agency policy, legal mandates and expert judgment or they can be identified through research of visitor perceptions (IVUMC 2019; Manning 2009).
Perceived Crowding
One approach to understanding social carry- ing capacity is through an examination of user perceptions of crowding (Shelby & Heberlein 1986). Perceptions are the way in which an individual absorbs information about the surrounding environment. The individual will then react based on their interpretations of experience and attitudes developed in reaction to that experience (Lime & Stankey 1971). Many early studies on crowding were conducted in federally designated wilderness after the creation of the Wilderness Act of 1964 (see Stankey & McCool 1984), which set aside tracts of land for the preservation of pristine environments and the chance of solitude.
One widely used method of measuring perceived crowding is a single item, nine-point Likert-type scale. This method has been used to look at patterns in perceived crowding across “studies, areas and time” (Manning 2001). For example, Shelby, Vaske, and Heberlein (1989) compared crowding studies over a fifteen-year period and found that boaters on the Deschutes River, Oregon, reported various perceived crowding ratings throughout the span of four separate studies. Studies have also shown that perceptions of crowding can differ between first time users and repeat visitors (Vaske, Donnelly & Heberlein 1980), and visitors of varying experience levels (Schreyer & Lime 1984).
More recently Ferguson and others (2018) examined Mount Hood ski lodge visitors and those people skiing, snowboarding, or sledding (snow users). This research suggested that, while some crowding existed across both segments (ski lodge users and snow users), the snow users reported less tolerance for other visitors. Kainzinger, Burns, and Arnberger (2015) noted both within-group and cross-group conflict and crowding in a study of North Umpqua river users. Although the crowding levels were low, overall trip satisfaction was impacted by crowding in both groups. Aikoh et al. (2018) used choice modeling to understand crowding norms in a world natural heritage site in Japan. As noted in many previous studies, the number of people in a given area tends to increase visitors’ perceptions of crowding, regardless of their crowding norms. Burns, Smaldone, Allen and Popham (2020) focused on understanding crowding in a low use wilderness setting, reporting the importance of setting management standards when attempting to use crowding as a management tool.
Purpose of Study
Wilderness management requires an understanding of area-specific recreational use levels, visitor densities, and the demand for recreation activities such as mountaineering. At Mt.
Hood, Oregon and Mt. Baker, Washington, effective management is heavily dependent upon understanding the extent to which recreationists utilize alpine areas, as well as their social and demographic characteristics, perceptions, and experiential preferences. This study examined the following questions:
- What are the demographic characteristics of climbers on Mt. Hood and Mt. Baker?
- Are there significant differences in the perceived quality of climbing experiences at Mt. Hood and Mt. Baker?
- Are there significant differences in climbers’ perceptions of crowding at Mt. Hood and Mt. Baker?
Study Locations
Mount Hood National Forest and Mount Baker-Snoqualmie National Forest both lie in the U.S. Pacific Northwest and are managed by the United States Forest Service, Region 6 (Figure 1). Region 6 encompasses a total of 17 forests, several National Recreation Areas, a National Scenic Area, a National Grassland and two National Volcanic Monuments. One of the major recreation activities that attract people from around the globe is recreational mountaineering on the several volcanic Cascade Peaks, such as Mt. Hood and Mt. Baker.
Mount Hood
Mt. Hood National Forest covers 1,067,043 acres of land including eight federally designated wilderness areas in northwestern Oregon. The largest, Mt. Hood Wilderness, was amongst the first wilderness areas des- ignated protected by the Wilderness Act of 1964. Undoubtedly one of the forest’s most prominent features is Mt. Hood, an 11,239-foot volcano and Oregon’s highest peak. The major metropolitan area of Portland, OR is located 50 miles west of the mountain’s base, making it a popular weekend destination for a wide variety of recreationists.
Climbing routes are spread out over 11 glaciers and range from beginner to advanced levels of difficulty. The most popular climbing routes and ice climbs are easily accessed on the South Side Approach. The trailhead for the South Side climb is located next to the historic Timberline Lodge and Ski Area. Most climbs on the South Side average less than three miles in length and usually require eight to twelve hours to complete. South Side climbs are also considered to be at a beginner- intermediate level in difficulty. Since climbers enter Mt. Hood National Forest Wilderness area on their route to the summit, all users are required to have a wilderness pass which is acquired at the Climbing Cave located in the ski area’s Wy’East Day Lodge.
As mandated but the Wilderness Act of 1964, federal land managers must address social carrying capacity levels. In the Mt. Hood Wilderness area, climbing parties are strictly limited to a maximum capacity of 12 members per group. Climbers are asked to fill out climb- ing registration forms and practice Leave No Trace ethics. Users may also access more dif- ficult climbing areas such as the Copper Spur Approach and Illumination Saddle Approach via wilderness trailheads like Cloud Cap and Tilly Jane on the mountain’s north side.
Mount Baker
The Mt. Baker-Snoqualmie National Forest spans 140 miles from Mt. Rainer to the British Columbian border and covers 1,724,229 acres. This forest contains several Scenic Byways, a National Wild and Scenic River, National Recreation Areas and ten federally designated wilderness areas. The forest lies directly east of the Seattle metropolitan area and, like Mount Hood, is a popular weekend retreat for city dwellers for fishing, rafting, skiing, and hiking. Mt. Baker lies in the North Cascades Range of Washington, near the border of the United States and British Columbia, Canada. At 10,778 feet, this volcanic mountain is the state’s third highest peak. Mt. Baker is renowned as the most glaciated peak in the Cascades and holds some of the highest snowfall records in the world.
Climbing routes and ice climbs are scattered across the Coleman, Boulder, Easton, North Ridge, Park and Squak Glaciers. Like Mt. Hood, the routes on Mt. Baker range from beginner to advanced level. The most popular routes are the Coleman-Deming Glacier route on the north side and the Easton Glacier route on the south side. A typical climb on Mt. Baker lasts two days in duration. Since climbers must camp on the mountain, they are encouraged to carry out all trash. Climbers on Mt. Baker are also required to purchase a Northwest Forest Pass to use the parking areas located at most of the trailheads. The north side of Mt. Baker and the actual summit lies in federally designated wilderness and parties are limited to 12 members per party. The south side of the mountain lies in the Mt. Baker National Recreation Area, so the number of members per party is not limited until the summit attempt. Climbing registration kiosks are located at the Sedro-Woolley Ranger Station for south side approaches and at the Glacier Public Service Center for north side approaches. As on Mt. Hood, climbing registration is encouraged but not required.
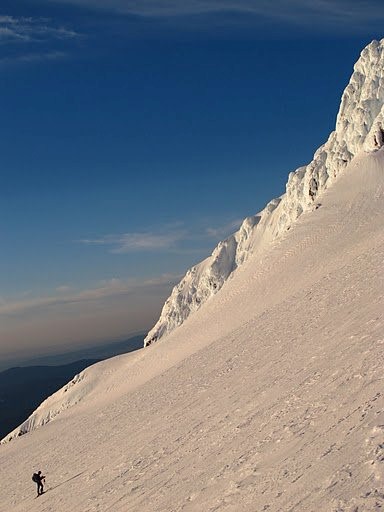
Figure 2 – Mt. Hood. Photo credit: Teri L. Chuprinko
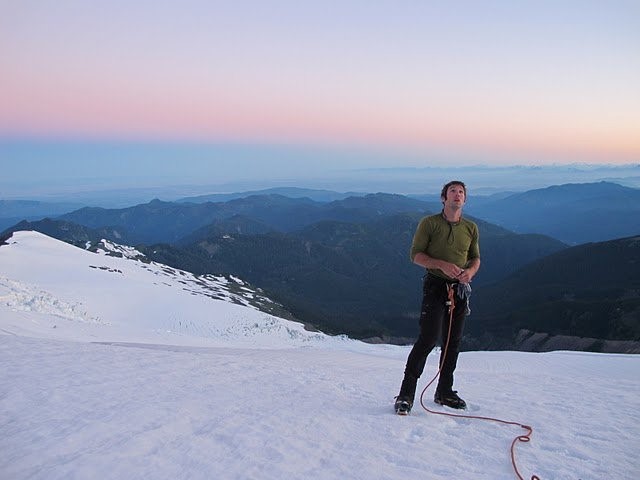
Figure 3 – Mt. Baker. Photo credit: Teri L. Chuprinko
Methods
Data Collection
This study utilized three methods of data collection: on-site interviews, an online survey, and a mail-back survey. Because visitors travel to both mountains for mountaineering and other recreational activities (e.g., skiing, snowboarding, snowshoeing, and hiking), respondents were asked to indicate their primary activity before further data were collected. To make sure that interview respondents were climbers, researchers asked each respondent if they were attempting to summit the peaks, ice climbing, or participating in a climbing course (e.g., crevasse rescue). Only those who answered, “Yes,” to this question were asked to continue with the interview. For the mail back survey responses, researchers only contacted visitors with Forest Service Wilderness Permits who indicated the mountain summit as the trip destination. The online survey was distributed only to previous clients and members of mountaineering clubs.
For the on-site interviews, sampling was conducted from May to August of 2010, which is the typical peak of the climbing seasons on both mountains. Researchers interviewed climbers using exit surveys of randomly selected party members. On Mt. Hood, the South Side trailhead was selected as the initial survey location. The South Side route receives the highest volume of both commercial and private traffic. More advanced climbers also descend via the South Side route from more difficult areas on the north side of the mountain. Interviews were also conducted on the Cloud Cap and Tilly Jane trailheads later in the season. However, these trailheads remained inaccessible due to a late season snowfall which occurred throughout much of the onsite data collection timeframe. On Mt. Baker’s north side, interviews were conducted on the Heliotrope Ridge trailhead. This trail provides access to the popular Colman-Deming route as well as the more advanced North Ridge ice climb. On Mt. Baker’s south side, interviews were conducted at the Park Butte trailhead, which allows access to climbs on the Easton Glacier. The Easton Glacier is a popular destination for not only summit attempts, but also ice climbing and crevasse rescue training.
All efforts aside, the inclement weather may have had a negative effect on the overall on-site data collection for the months of May and June. On Mt. Hood, a total of 144 completed onsite interviews were collected out of the 190 climbers intercepted, yielding a 76% response rate. On Mt. Baker, there was a total of 166 completed onsite interviews out of the 218 climbers intercepted, yielding a 76% response rate. Refusals to participate in onsite interviews could possibly be attributed to the high degree of physical activity that mountaineering requires, inclement weather, or other contextual factors.
The second data collection method was through an online survey. Contact information was collected from the intercepted climbers who were interested in participating in the study but preferred to complete the survey on their own time. These contacts were sent a link to complete the online survey. The online survey was administered in a software platform that included a security feature allowing only one submission per computer IP address. This feature helped mitigate repeat responses and preserve the validity of the data collected using this methodology. Researchers also examined each individual IP address on the surveys, and any repeat IP addresses were deleted before being transferred to the database. After deleting repeat or illegible addresses, researchers were left with 389 possible contacts for Mt. Hood and 421 contacts for Mt. Baker.
The third method of data collection was through a mail-back survey. Resource managers provided researchers with a list of 407 names, addresses, and phone numbers of people who climbed Mt. Hood during two full climbing seasons. This information was obtained from the climbing registration forms and Wilderness Permits that indicated intent to summit Mt. Hood. For Mt. Baker, resource managers provided researchers with a list of 400 names, addresses, and phone number from the climbing registration forms for the two full climbing seasons. Following the Dill- man et. al (2014) methodology, the addresses on each survey and postcard sent out for the mail-back portion of the study were handwritten. The first round of surveys for Mt. Hood was sent out on May 15th. Since researchers received the Mt. Baker contacts later in the summer, the first round of surveys was not sent until August 20th. The final numbers of correct possible contacts were 326 (Mt. Hood) and 352 (Mt. Baker). In attempts to attain a higher response rate for both surveys, postcard reminders were sent out in mid- September for Mt. Hood and in late October for Mt. Baker. The total number of Mt. Hood mail-back responses was 173 with a response rate of 53.4%. The total mail-back response for Mt. Baker was 172 with a response rate of 48.8%. Overall, out of 678 possible contacts, researchers received a total of 346 responses with response rate of 51.0%.
Results
Overall, the sample of climbers interviewed was middle-aged, highly educated, white males. Most climbers were male (86.5%; N = 721) with only a small portion being female (13.5%; N = 113). Half (50.2%) of the respondents fell into the 31-50 age group. Overall, the climbers on Mt. Hood and Mt. Baker were highly educated. Nearly one-half (44.1%) of respondents had earned a bachelor’s degree, and more than one–fourth of the sample obtained a master’s degree. Approximately 11.9% of the respondents had earned a Ph.D., M.D., J.D or other Professional degree. The sample almost entirely consisted of white-Anglo-Americans/Eastern Europeans (99.2%), whereas only a small proportion (1.6%) indicated being of Hispanic, Latino or Spanish ethnic origin.
Quality of Climbing Experiences
The analysis showed significant differences in whether climbers had to wait at “choke points” (crowded or highly congested areas) while on their climbing routes (Table 1). Over- all, most climbers on Mt. Baker (83.9%) and Mt. Hood (67.0%) did not report waiting at choke points or crowded areas while on their climb. However, one-third (33.0%) of Mt. Hood climbers indicated that they had to wait at choke points or crowded areas, which was about twice as many climbers as on Mt. Baker (16.1%) (x2 = 31.450, df = 1; p < .001).
Climbers on Mt. Baker and Mt. Hood expressed similar preferences for seeing groups while
on their climbing route (x2 = .032, df = 1; p > .05). Approximately one-third of climbers on each mountain indicated that it would matter if they saw groups while climbing, whereas two-thirds said that this would not matter (Table 1). Climbers’ responses varied significantly when asked to indicate an acceptable percentage of time to see other groups while on their climbing routes (x2 = 18.698; df = 4; p < .001). About half of the respondents on Mt. Baker (51.0%) would be comfort- able seeing other groups during 21-50 percent of their climbs. Conversely, on Mt. Hood about half (49.0%) would find seeing groups over 50 percent acceptable (37.0%).
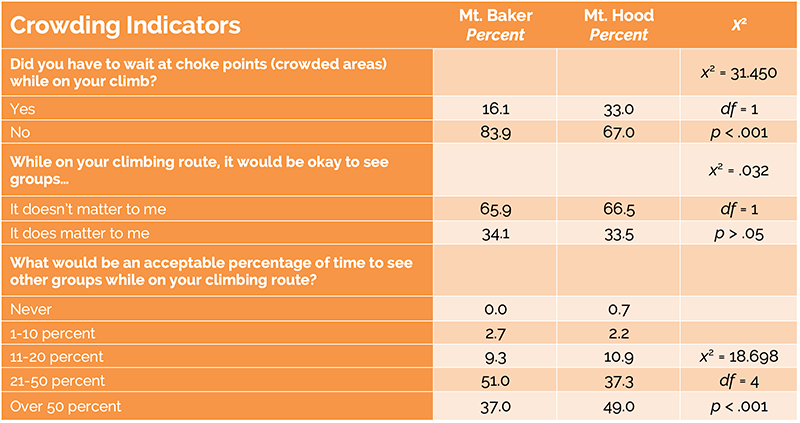
Table 1 – Mt. Hood and Mt. Baker climbers’ responses to crowding indicators.
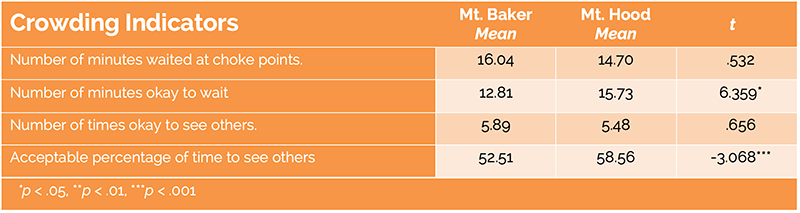
Table 2 – Comparison of crowding indicators reported by Mt. Hood and Mt. Baker climbers.
Several crowding indicators were analyzed with an independent samples t-test to determine if differences existed between the mean responses of climbers at Mt. Hood and Mt. Baker respondents (Table 2). Of the four indicators analyzed, two yielded significant differences. First, the climbers were asked to report the percentage of time acceptable to see other groups while on their climbing routes. Results showed that climbers on Mt. Hood (M = 58.56) approved seeing others at a significantly higher rate than at Mt. Baker (M = 52.51, (t = -3.068; p < .001). Furthermore, climbers who reported that waiting at choke points mattered to them were asked to report an acceptable amount of time (in minutes) to wait at choke points. The results, though sig– nificantly different (M = 12.81, t = 6.359; p < .05), varied little. Mt. Hood climbers were willing to wait about 16 minutes (M = 15.73) at choke points, whereas climbers on Mt. Baker would be willing to wait about 13 minutes.
Perceptions of Crowding
The climbers were asked to indicate how crowded they felt during their most recent climbing experiences on Mt. Baker and Mt. Hood (Table 3). Overall, most climbers on Mt. Baker (74.3%) and Mt. Hood (69.8%) perceived relatively low levels of crowding. However, the climbers on each mountain differed in their distribution of responses (x2 = 21.161, df = 3; p < .001). A significantly larger proportion of climb- ers on Mt. Hood (43.6%) indicated that they were not at all crowded than those who were climbing on Mt. Baker (37.7%). However, more climbers on Mt. Baker (36.6%) reported feeling slightly crowded than those on Mt. Hood (26.2%). Nonetheless, Mt. Hood climbers were much more likely to feel moderately crowded (30.2%) to extremely crowded (5.0%) than Mt. Baker climbers.
Climbers were also asked to indicate their perceived level of crowding compared to what they expected to see (Table 3). The distribution of responses was significantly different between the two mountains (x2 = 23.704, df = 5; p < .001). Generally, climbers on both mountains reported seeing about the same amount of crowding that they expected to see. However, 25.8% of climbers on Mt. Baker reported seeing higher crowding levels than they expected, whereas 27.9% of climbers on Mt. Hood reported seeing lower crowding levels than they expected.
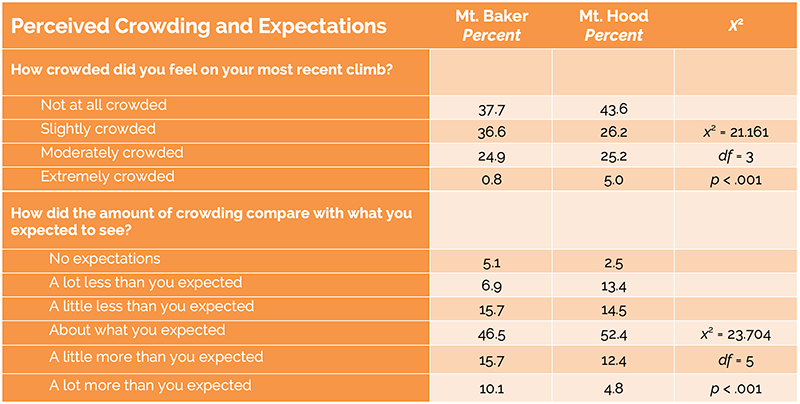
Table 3 – Mt. Hood and Mt. Baker climbers’ responses to perceived crowding and expectations.
On a five-point scale, the climbers rated the extent to which they agreed or disagreed with a series of crowding attributes pertain- ing to their recreation experience (Table 4). Overall, climbers on both Mt. Baker (M = 4.17) and Mt. Hood (M = 4.00) generally agreed that they were able to recreate without feeling crowded. The statement, I avoided some places because there were too many people, yielded a significantly stronger level of disagreement from climbers on Mt. Baker (M = 2.23) than those on Mt. Hood (M = 2.48, t = -2.961; p < .001). However, climbers on Mt. Hood (M = 3.19) expressed more agreement with the statement, the other people increased my enjoyment, than the climbers on Mt. Baker (M = 3.04, (t = -2.338; p < .001).
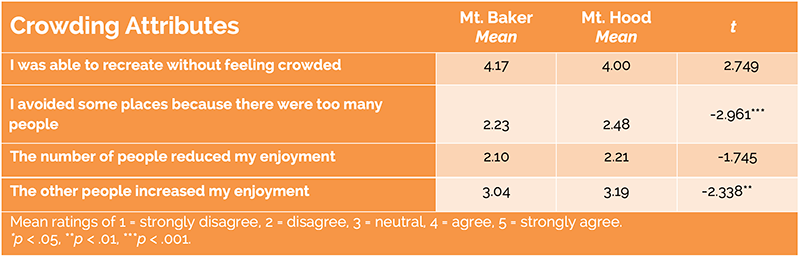
Table 4 – Comparison of crowding attributes rated by Mt. Hood and Mt. Baker climbers.
Discussion and Conclusion
This study goes beyond obtaining a basic understanding of who the climbers are on Mt. Hood and Mt. Baker and understanding their crowding levels. The findings show that the perceived quality of mountaineering experiences relative to perceived crowding on the two peaks is generally quite high. Additionally, this study found that perceived crowding on the two peaks is at a low or acceptable level. This notion is supported by the fact that the climbers’ actual wait times on climbing routes were equal to the wait times climbers considered acceptable. Furthermore, most climbers accepted seeing other groups while on a climbing route and felt only slightly or not at all crowded during their climbing experiences on the two mountains. This suggests that the visitor density levels and wait times did not interfere with mountain climbing experiences relative to perceived crowding, and the management thresholds for carrying capacity is appropriate.
When interpreting these results, it is important to acknowledge that these are visitor perceptions. Two-thirds of the visitors said the number of other groups seen on their climbing route did not matter to them, but conversely 80% said waiting for others at choke points did mat– ter. This suggests that crowding is extremely site specific on these mountains. This is supported by the notion that most respondents had the opportunity to recreate without crowding, and most disagreed that the number of others reduced their enjoyment. Put simply, visitors perceived some minor level of crowding, but overall, their experiences were not negatively impacted by other visitors. Management may consider focusing on specific choke points and developing management schemes for these specific, known settings. However, the results show that crowding is not a critical variable to managers currently. Resource managers should consider following this trend over time to understand how crowding changes, if at all. In addition, while some significant differences were seen regarding the variables across the two mountain set– tings, these were not “managerially” significant. The differences are not so great that managers should deviate in a management strategy in both places. Mt. Baker climbers reported it would be ok to see others 52% of the time while Mt. Hood climbers said 58% of the time. Similarly, Mt. Baker visitors accepted a wait time of about 13 minutes while Mt Hood climbers reported about 16 minutes was appropriate. Regardless of these significant differences, most visitors on both mountains said it was okay to see others most of the time, and there was agreement that waiting between 10-15 minutes would be okay.
Management is driven by social values and the perspectives of resource users, yet at the same time, must balance the amount of use with the quality of natural resource conditions.
Implications
Perhaps one unanswered question is, for whom are the resource staff managing? In 2000, when a team of resource managers and social researchers were examining outdoor recreation use in wilderness settings, Freimund and Cole (2001, p.2) explained that, “Mt. Hood is one of the most frequently climbed mountains in the world. On an average weekend, more than 200 people per day summit Mount Hood via the South Climb route. On some days, over 400 people attempt the summit.” Yet, most recreationists in this study did not feel crowded. In fact, they felt that the number of other people they saw was appropriate. These findings are consistent with the carrying capacity thresholds set by managers and suggests that these levels are acceptable from a social perspective. Monitoring of visitor density and perceived crowding levels informs management when thresholds are at risk of being crossed and whether further action is required to prevent a decline in the quality of recreational (and environmental) conditions. If monitoring continues to indicate the capacity thresholds are not being exceeded, no further action may be needed. However, managers must also consider whether the capacity levels continue to help sustain natural resource conditions in wilderness areas.
Management is driven by social values and the perspectives of resource users, yet at the same time, must balance the amount of use with the quality of natural resource conditions. The data reported here show that the amount of use is “appropriate” from the perspective of climbers on Mt. Hood and Mt. Baker. It is up to resource management professionals to ensure that use on these mountains is appropriate when compared to Forest Service or other legislating documents, such as the Wilderness Act of 1964 or forest management plans. Standards for what is appropriate is informed by both natural resource and social values. Managing by matching visitor perceptions with federal legislative mandates will be a challenge, as pressure is bound to be placed on resource staff from all angles. By investing in a sustained data collection effort, Region 6 managers are demonstrating a will to make decisions that have the potential of positively impact the greatest proportion of visitors. An unanswered question is how the findings of this study compare to other Wilderness activities and settings. A future direction will be to compare crowding expectations across riverine and land-based settings to determine the universality of visitors to wilderness settings.
Acknowledgements
Funding for this study was provided by the US Forest Service, Region 6, and the National Institute of Food and Agriculture (NIFA).
About the Authors
DR. ROBERT C. BURNS is director of the Division of Forestry and Natural Resources, West Virginia University and an interdisciplinary social scientist; email: Robert.burns@mail.wvu.edu
DR. MARY E. ALLEN is a social scientist with Lynker, Inc. under contract to the National Oceanic and Atmospheric Administration’s Coral Reef Conservation Program, Office for Coastal Management, and also leads the National Coral Reef Monitoring Program’s socioeconomic component; email: Mary.Allen1@mail. wvu.edu
TERI L. CHUPRINKO is in the School of Public Health, West Virginia University; email: Teri.chuprinko@hsc. wvu.edu
References
Aikoh, T., Y. Shoji, T. Tsuge, S. Shibasaki, & K. Yamamoto. 2020. Application of the double-bounded dichotomous choice model to the estimation of crowding acceptability in natural recreation areas. Journal of Outdoor Recreation and Tourism 32: 100195
Burns, R. C., T. Chuprinko,., & M. E. Allen. 2020. Understanding Pacific Northwest (U.S.) mountain climbers’ motivations: Mount Baker, Washington, and Mount Hood, Oregon. Eco Mont: Journal on Protected Mountain Area Research and Management 12(1): 4-14.
Burns, R. C., D. Smaldone, M. E. Allen, & A. Popham. 2020. Monitoring Outdoor Recreation Use: The Umatilla National Forest, Wenaha Wild and Scenic River Corridor. International Journal of Wilderness 26(1): 54-71.
Dillman, D. A., J. D. Smyth, and L. M. Christian. 2014. Internet, phone, mail, and mixed-mode surveys: The tailored design method. John Wiley & Sons.
Ferguson, M. D., R. C. Burns, & D. Smaldone. 2018. Innovations in outdoor recreation visitor use management: Applying market segmentation at the Timberline Lodge Recreation Complex. International Leisure Review 7(1): 108-131.
Freimund, W. A., & D. N. Cole. 2001. Use density, visitor experience, and limiting recreational use in Wilderness: Progress to date and research needs. In Visitor use density and wilderness experience: proceedings; 2000 June 13; Missoula, MT. Proceedings RMRS-P-20. Ogden, UT: U.S. Department of Agriculture, Forest Service, Rocky Mountain Research Station. 67 p.
Hall, T. E., & D.N. Cole. 2007. Changes in the Motivations, Perceptions, and Behaviors of Recreation Users: Displace– ment and Coping in Wilderness. Research Paper RMRS-RP-63. US Department of Agriculture, Forest Service, Rocky Mountain Research Station, Fort Collins, CO, 37 pp.
IVUM (Interagency Visitor Use Monitoring Council). 2019. Visitor Capacity Guidebook
Managing the Amounts and Types of Visitor Use to Achieve Desired Conditions. Lakewood, CO. https://visitoruseman– agement.nps.gov/VUM/Framework.
Kainzinger, S., R. C. Burns, & A. Arnberger. 2015. In-group and out-group conflict between whitewater boaters and an– glers: The case of the North Umpqua Wild and Scenic River, Oregon. Human Dimensions of Wildlife 20(6): 542-552.
Lime, D., & G. Stankey. 1971. Carrying capacity: Maintaining outdoor recreation quality. Recreation Symposium Pro– ceedings. USDA Forest Service, 174-184.
Manning, R. E. 2001. Programs that work visitor experience and resource protection: A Framework for managing the carrying capacity of National Parks. Journal of Park and Recreation Administration 19(1): 93-108.
Manning, R. E. 2007. Parks and carrying capacity: Commons without Tragedy. Washington DC: Island Press.
Manning, R.E. 2009. Parks and people: Managing outdoor recreation at Acadia National Park. Lebanon, NH: University of Vermont Press.
Outdoor Industry Foundation. 2018. Outdoor Recreation Participation Report, 2018. Boulder, CO.
Schreyer, R., & D. W. Lime. 1984. A Novice isn’t necessarily a novice: The influence of experience use history on subjec– tive perceptions of recreation participation. Leisure Sciences 6(2): 131-149.
Shelby, B., & T. A. Heberlein. 1986. Carrying Capacity in Recreation Settings. Corvallis, OR: Oregon State University Press.
Shelby, B, J. J. Vaske, & T. A. Heberlein. 1989. Comparative analysis of crowding in multiple locations: Results from fif– teen years of research. Leisure Sciences 11(4): 269-291.
Stankey, G. H., & S. F. McCool. 1984. Carrying capacity in recreational settings: Evolution, appraisal, and application. Leisure Sciences 6(4): 453–473.
Vaske, J. J., M. P. Donnelly, & T. A. Heberlein. 1980. Perceptions of crowding and resource quality by early and more recent visitors. Leisure Sciences 3(4): 367-381.
Vaske, J. J., & M. P. Donnelly. 2002. Generalizing the encounter-norm-crowding relationship. Leisure Sciences 24, 255- 269.
Wagar, J. A. 1964. The Carrying capacity of wild lands for recreation. Forest Science Monograph 7. Washington, DC: Society of American Foresters.
Wagar, J. A. 1974. Recreational carrying capacity reconsidered. Journal of Forestry 72: 274-278.
Williams, P., &G. Soutar. 2005. Close to the “edge”: Critical issues for adventure tourism operators. Asia Pacific Journal of Tourism Research 10(3): 247-261.
Read Next

Ambition: The Power of a Big Idea and Sticking to it
Protecting Half of Earth’s land and seas requires the power of persistence, truth and relationships.
Preserving the Wildness of Wilderness in the Anthropocene
Wildness: What is this evocative and elusive, primal and unquantifiable quality of Wilderness? Why is it so threatened in the non-analogue future we face? Why and how should we perpetuate it?
The Evolution Of Management Science To Inform Carrying Capacity Of Overnight Visitor Use In The Yosemite Wilderness
To avert overcrowding, mitigate biophysical impacts, and ensure quality wilderness experiences, managers utilize a suite of management tools, including inventories and assessments of wilderness campsite and social conditions, to evaluate changes to use and condition over time.