© Boyd Norton
The River Wild: Towards a Global Assessment of Wild Rivers
International Perspectives
April 2018 | Volume 24, Number 1
PEER REVIEWED
ABSTRACT This article looks at the global distribution of wild rivers using GIS-based approaches with the aim of developing and exploring more unified approaches to wild river identification and appraisal. There are several published versions of a global wilderness map but no integrated global map of the distribution of wild rivers. Global hydrological datasets are integrated here with global wilderness maps to identify the top 10% wildest rivers at both global and continental scales. The discussion and conclusions cover the dangers of overreliance on global datasets and the need for multiscale analyses incorporating finer scale datasets and local knowledge.
Rivers are an integral part of all landscapes. Running water can be found almost anywhere on the planet, from the polar regions to the driest of deserts. Rivers perform a vital role in connecting mountains to the sea, and are conveyors not just of water, but also sediments and dissolved solids and nutrients. They are agents of change, reflecting cycles of flood and drought, and periods of erosion after which sediments are transported downstream and ultimately deposited in the oceans. Rivers provide habitats for wildlife, not just for fish and other aquatic organisms but for all biodiversity that relies on them to provide water that is essential for life. For us as humans, rivers provide us with water to drink, to irrigate our crops, and to power our industry. They also provide us with stimulating recreational environments and some of the finest scenery on the planet. Yet over the years we have overexploited many of our rivers. We have used them as a water source, for travel and transport, and as convenient dumping grounds for our waste. We have sought to control rivers with dams and levees, attempting to tame their flood-drought cycles, and put them to work generating electrical energy. As a result, many rivers are now pale reflections of their former selves, and without protection many more rivers may well be degraded and lose their wildness and the ecosystem services they provide. Being able to recognize and identify the world’s remaining wild rivers in a rigorous and repeatable manner is perhaps the first step toward better protection.
Protection for Wild and Scenic Rivers
Our appreciation of the natural beauty of rivers and recognition of the threats they face provides the backdrop against which the US Wild and Scenic Rivers Act (1968) was passed (see Palmer 2017). The United States is not alone in providing a level of protection for its free-flowing wild rivers. Similar systems are present in Canada, Australia, and New Zealand. The Canadian Heritage Rivers System (CHRS) is like that of the United States. It was established in 1984 and “gives national recognition to Canada’s outstanding rivers and encourages their long-term management to conserve their natural, cultural and recreational values for the benefit and enjoyment of Canadians, now and in the future” (http://chrs.ca/). There are currently 42 such rivers designated under the CHRS, totaling some 12,000 kilometers (7,456 miles) of rivers across the whole of Canada. However, unlike the United States, the CHRS is a voluntary process involving the nomination of rivers by provincial/territorial governments after which rivers are designated only after a rigorous screening process. The CHRS recognizes the continuing and historical importance of rivers to Indigenous people as well as early settlers and to contemporary industry, landscape, and environment.
New Zealand also has similar legislation and protects wild waters for scenic, recreational, and habitat purposes. This is implemented through Water Conservation Orders (WCOs) and began in 1984 with 15 rivers throughout New Zealand protected under this legislation (NZCA 2011). WCOs can be applied to all water bodies including rivers, lakes, ponds, wetlands, and geothermal waters. They are used to provide protection to the water body’s natural state as habitats for terrestrial and aquatic life; for its “wild, scenic or other natural characteristics”; its scientific or ecological values; and recreational, historic, spiritual, and cultural purposes.
In Australia, the Wild Rivers Project sets out to “identify rivers, encourage protection, engage in voluntary management of the whole catchment, and promote the values of wild rivers” Whereas the rivers represented in the US National Wild and Scenic Rivers System (NWSRS) are included based on a case-by-case evaluation, the Australian system adopts a more quantitative, GIS-based approach. This builds on the Australian National Wilderness Inventory, which is itself a GIS-based mapping of wilderness quality across the whole of Australia (Lesslie and Maslen 1995). The Australian approach to designating their wild rivers is based on a River Disturbance Index (RDI). This is modeled across all rivers using a combination of spatial indices describing wildness within the river’s catchment. These include land use, settlement, infrastructure and extractive industry, and point pollution sources, together with indices describing specific impacts along the river itself, including dams/impoundments, flow diversions/water abstractions, and levees. Mapped at a national scale, the RDI describes a continuum of river disturbance from near pristine to highly degraded (Stein et al. 2002; Stein et al. 2001; Stein et al. 1999).
In Europe, the Water Framework Directive provides a framework for protecting water quality and habitats throughout the European Union with the emphasis on integrated catchment management. While there may be few if any truly wild and free-flowing rivers of any appreciable size left in Europe, there is a growing recognition of the value of wild rivers for associated values of natural habitats and processes, recreation, and heritage. The European Rivers Network is an NGO set up to promote this ideal and develop relevant projects throughout the EU working on the back of protected area legislation such as Natura2000 and the Habitats Directive (http://www.ern.org/en/).
Integrated Thinking
If we look solely at the river and its floodplain when thinking about protecting the world’s remaining wild rivers, then we are in danger of missing a key part of the picture. Rivers are not just convergent linear networks but are also connected to the entire landscape via all the processes inherent within the hydrological cycle that govern runoff generation. As a result, current thinking in water and land management focuses more on integrated catchment management, since to protect the river and its values associated with flow regimes, water quality, recreation, and wildlife, we must also act to protect its catchment (Mitchell and Hollick 1993). It has long been recognized that clean water supplies come from catchments that are protected from degradation, be it through agriculture, deforestation, industry, extractive land uses, or settlement. For this reason, metropolitan areas often seek to protect the watersheds providing the city’s water supplies rather than pay for expensive “end of pipe” treatment of polluted water.
“If we look solely at the river and its floodplain when thinking about protecting the world’s remaining wild rivers, then we are in danger of missing a key part of the picture. Rivers are not just convergent linear networks but are connected to the entire landscape.”
Therefore, protecting the wilderness qualities of the river catchment is the key to protecting the wildness of the river. If we can map that connectivity between land and river and how human activity within the catchment (including settlement and transportation infrastructure) and modification via human land use (agriculture, forestry, etc.) influence the hydrological functioning of watersheds, such as providing natural water flows, then we can create a draft inventory of wild rivers using purely global datasets. The remainder of this article will explore the potential and difficulties of such a model and approach.
Methods
The work presented here uses global datasets to identify the wildest rivers in the world. The datasets used here are the Human Footprint version 2, Hydro1K 30ArcSecond global DEM, and the Global Reservoir and Dams database (GRanD). Using a nested multiscaled approach, it is possible to sequentially identify the wildest rivers at a global level, on each continent, and then in each country, although for many smaller countries (e.g., Belgium or Belize) the limited resolution of the global datasets could easily present a problem requiring substitution of national level datasets. The basic model proposed links wilderness quality within a catchment to its river using a weighted flow accumulation model to create a classification of rivers and their catchments, such as that described by the Australian Wild Rivers Project, from pristine to heavily modified. This works by totaling the level of upstream human impact based on the assumption that catchments with greater upstream impacts will exhibit corresponding impacts on the wildness of the river.
Global wilderness maps range from the McCloskey and Spalding map published for the 4th World Wilderness Congress in 1987 (McCloskey and Spalding 1989) to the Human Footprint version 2 “Last of the Wild” project in 2005 (Sanderson et al. 2002; WCS 2005). Various other global scale maps and databases exist showing roadless areas (Ibisch et al. 2016), human impact on the world’s oceans (Halpern et al. 2008), and declining wilderness areas (Watson et al. 2016). Except for the McCloskey and Spalding map, which was produced largely by hand from Jet Navigation Charts, all of these works are made possible by the availability of global digital spatial datasets. The Human Footprint data developed by CIESIN and WCS can be used as a global wilderness quality index to provide information on how settlement, transport infrastructure, and land use negatively impact natural ecosystems (Sanderson et al. 2002).
Hydro1K is a hydrological corrected digital elevation model that includes a river network, a flow direction matrix, and six levels of nested catchments using Pfafstetter units (Verdin and Verdin 1999). Pfafstetter units are a means of codifying nested drainage basins based on a hierarchical system from continental scale drainages (level 1) through to higher orders (levels 2–6). Within the system there are three types of drainage: basin (a drainage area that does not receive water from any other drainage), interbasins (which receive water from upstream basins), and internal basins (which do not contribute water to another drainage or ocean/lake). The coding allocated to each basin is unique and allows the user to identify where a drainage sits within the nested series of basins below level 1. Not all the world’s catchments are codified to the same degree. There are some large and poorly delimited areas within the Amazon basin, Himalayas, eastern and southern Europe, southern Africa, and the Arabian Peninsula. The GRanD database (Lehner et al. 2011) is used to identify unregulated rivers and augment the Human Footprint dataset.
The Hydro1K flow direction matrix and Human Footprint version 2 data are used together to perform a global weighted flow accumulation analysis using the hydrological modeling tools in ArcGIS 10 to calculate how the level of human impact “accumulates” downstream through the drainage networks to show the wildest rivers (i.e., those with highest upstream wilderness quality). Statistics on downstream human impact (minimum, maximum, mean, range, standard deviation) are then calculated for each of the six Pfafstetter levels in the Hydro1K nested catchments database, which enables the classification of catchments on a scale of pristine to heavily modified.
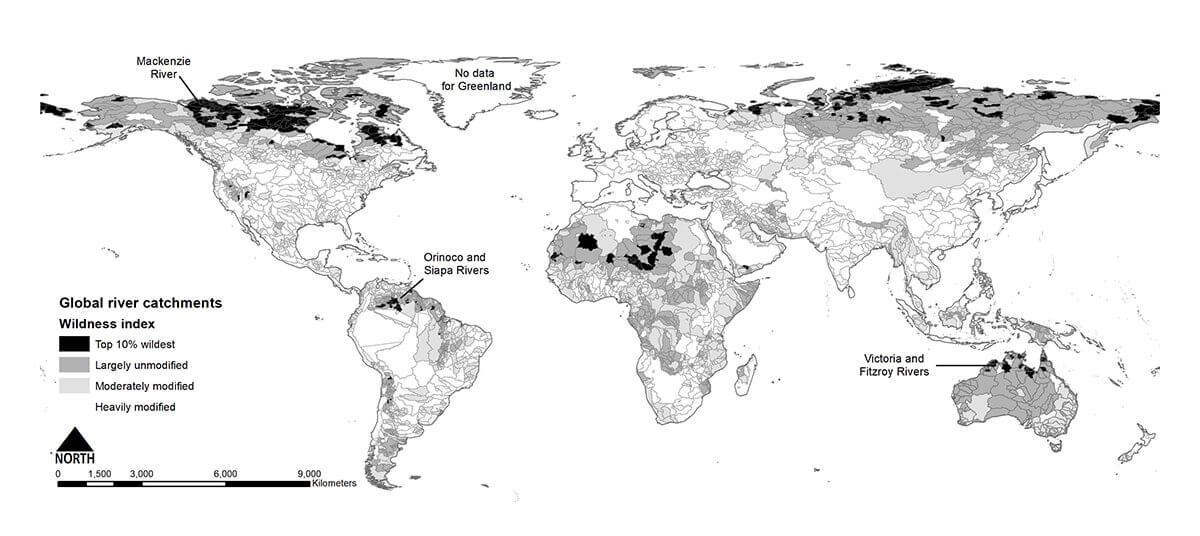
Figure 1 – Global river catchments wildness index.
Results
Basic classifications of the wildest rivers and their contributing catchment areas are presented in Figures 1–7. Figure 1 presents the global picture with the top 10% wildest river catchments highlighted, while Figures 2–7 show similar maps scaled for each of the continents (excluding Antarctica). Other catchments are classified into one of three groups based on percentiles along the wilderness index as follows: largely unmodified (90–60%), moderately modified (60–30%), and heavily modified (30% and below). Although it is possible to map every statistic for each of the six nested Pfafstetter levels, we are principally interested here in the maximum wilderness quality within mid-level catchments that can robustly map the distribution of wild rivers without undue generalization or too much detail. The maps presented are therefore for the maximum accumulated human impact within Pfafstetter level 3 catchments.
Many of the wildest rivers fall mainly into permafrost or desert environments (Figure 1). As such these rivers are likely to be ephemeral and only flow when fed either from seasonal ice/snowmelt (e.g., Mackenzie River in Canada) or high magnitude/low frequency flash flood events in desert areas. Mid-latitude rivers in temperate or moist tropical regions are not well represented in the top 10% of wildest rivers at a global scale, the exception being those within the intact tropical rain forest areas of northern Amazonia (e.g., Orinoco and Siapa) and the larger rivers draining northern Australia (e.g., Victoria and Fitzroy).
The distribution of wild rivers at a continental scale shows a similar pattern (Figures 2–6), although more mid-latitude rivers exhibiting “normal” (i.e., constantly flowing with minimum base flow > zero) flow regimes are represented.

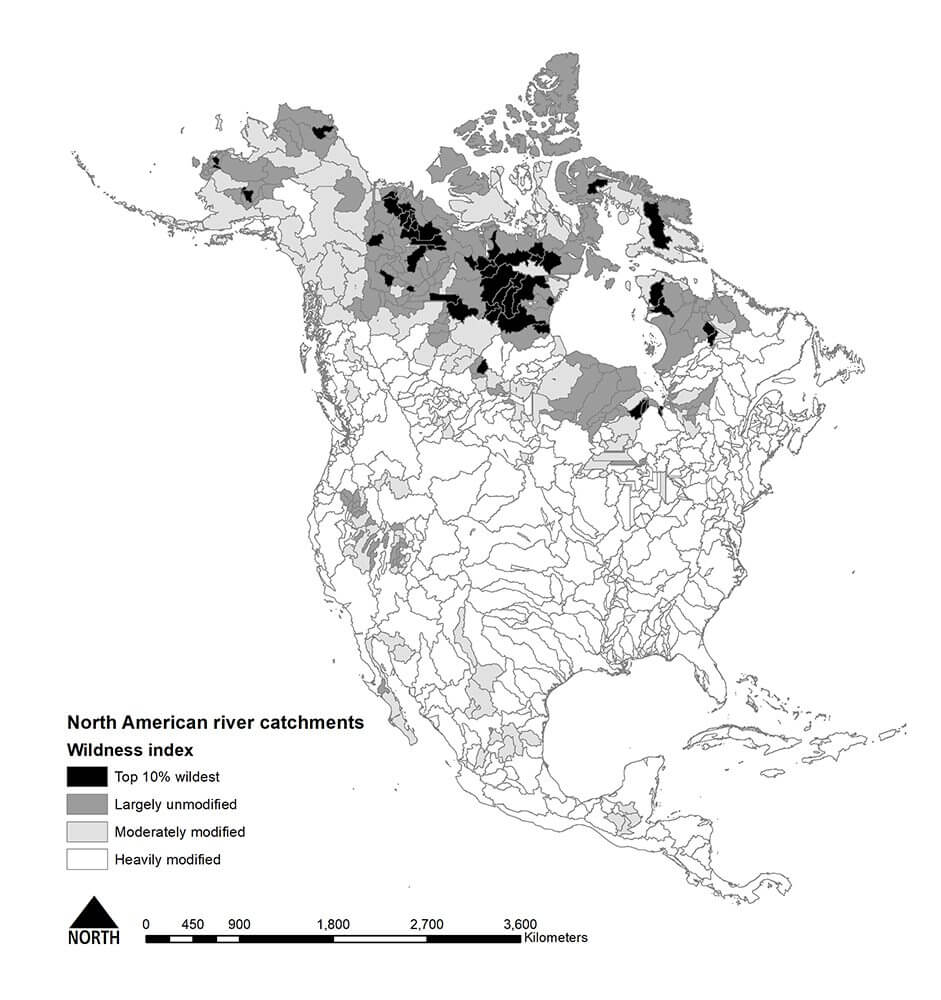
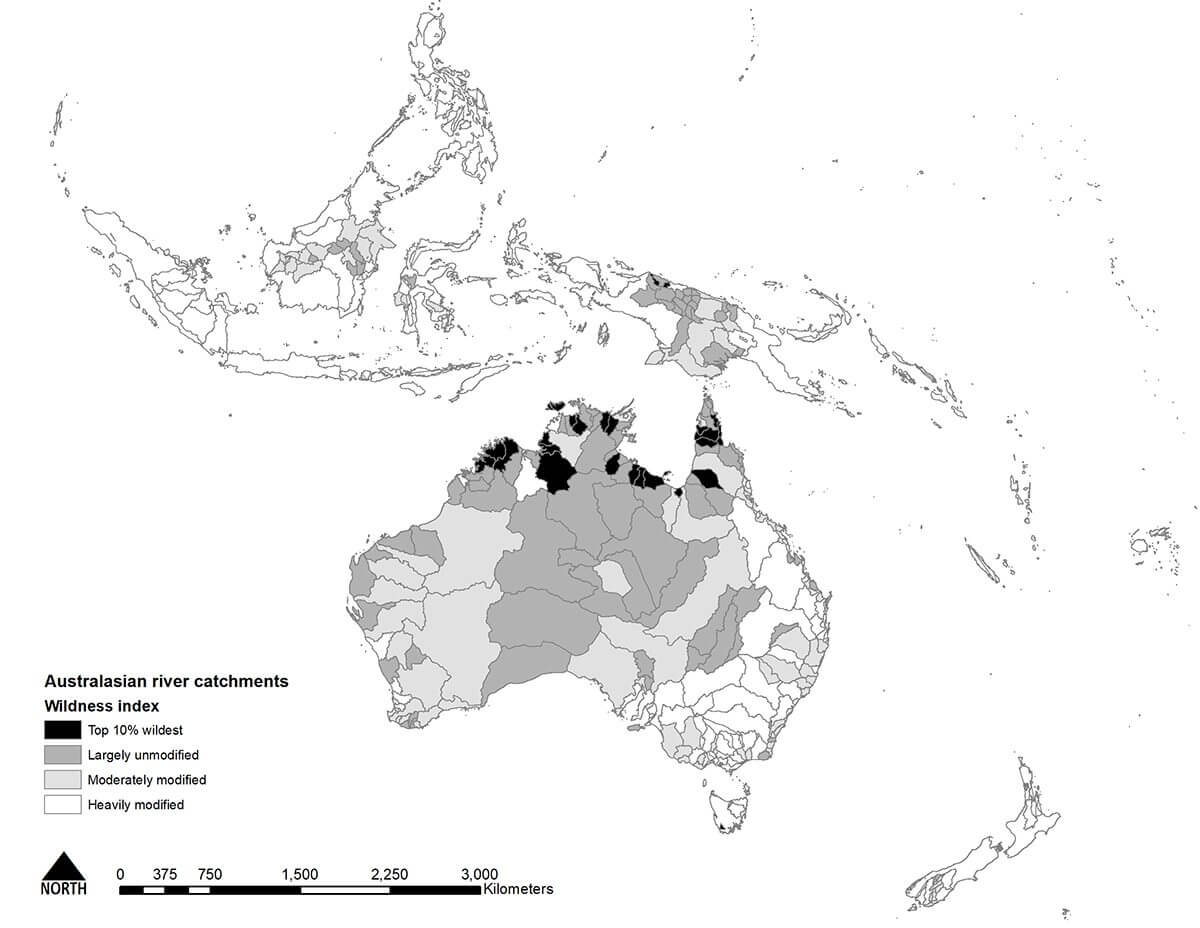
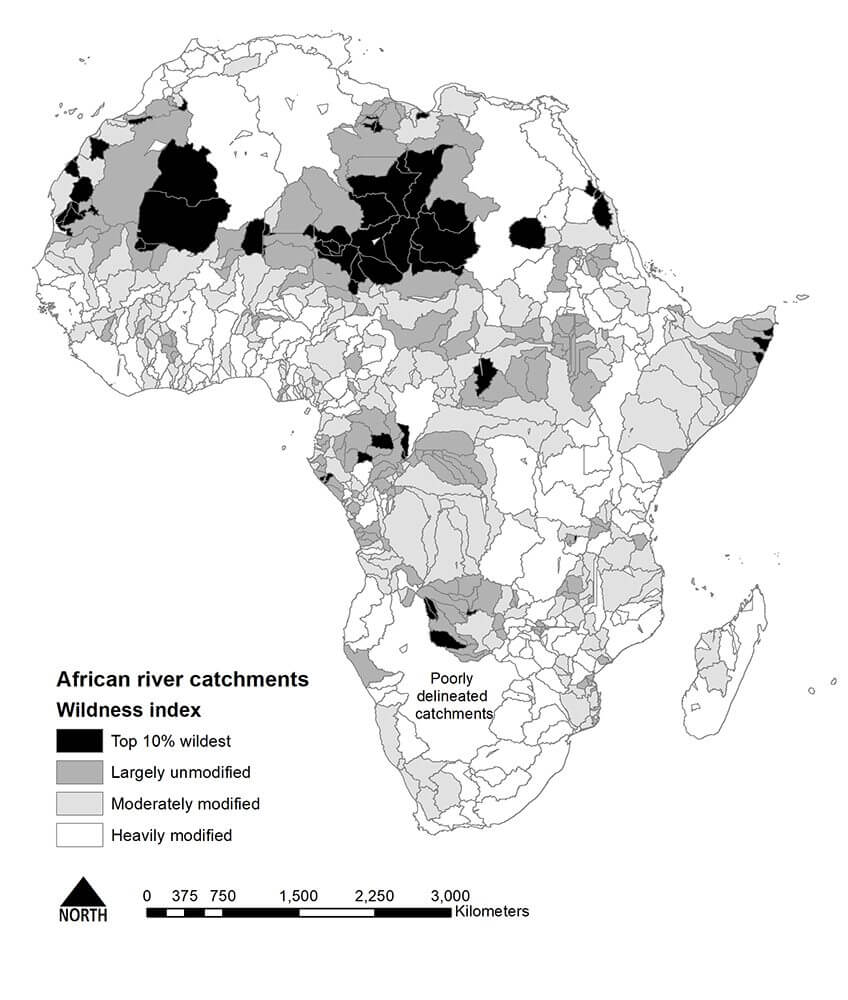
Figure 2-5 – Worldwide river catchments wildness index.: North America,, Africa, Australia and Europea & The Middle East.
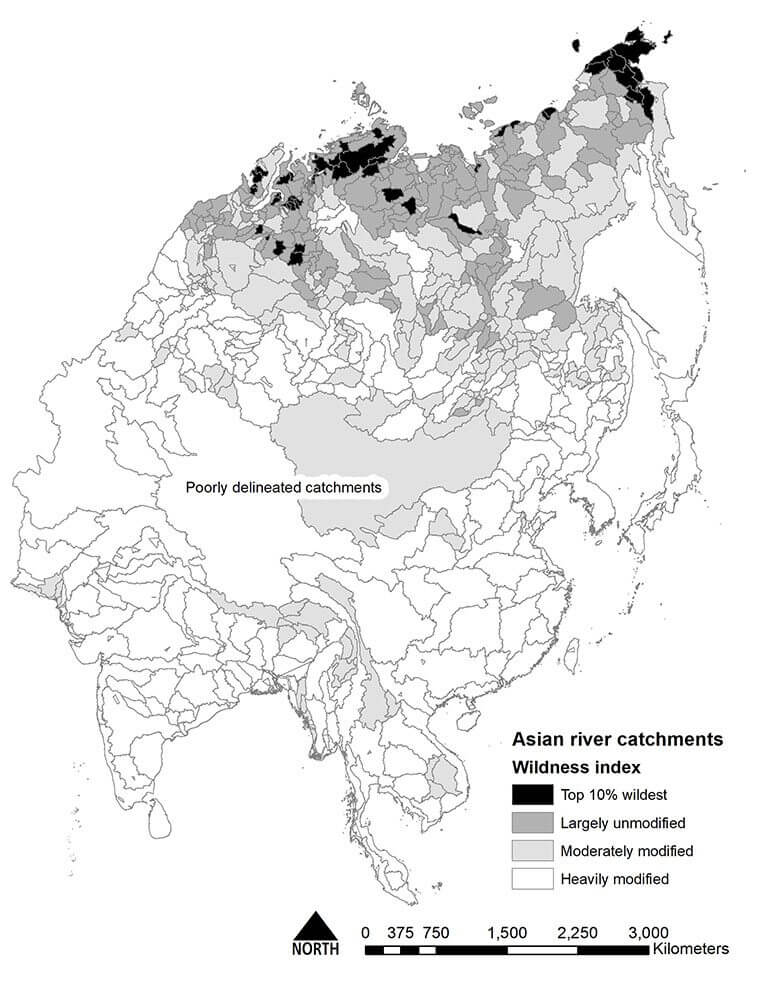

Figure 6 & 7 – Worldwide river catchments wildness index.: Asia & South America
At a country level, the patterns are more widely dispersed. Figure 8 shows the pattern of wild rivers and their catchments for the lower 48 in the United States. While most of the top 10% of wildest catchments are in the west and many are internal basins in the deserts of Nevada, California and Arizona, several key mountain river catchments are present, including many within the NWSRS such as the Clearwater and Salmon Rivers.
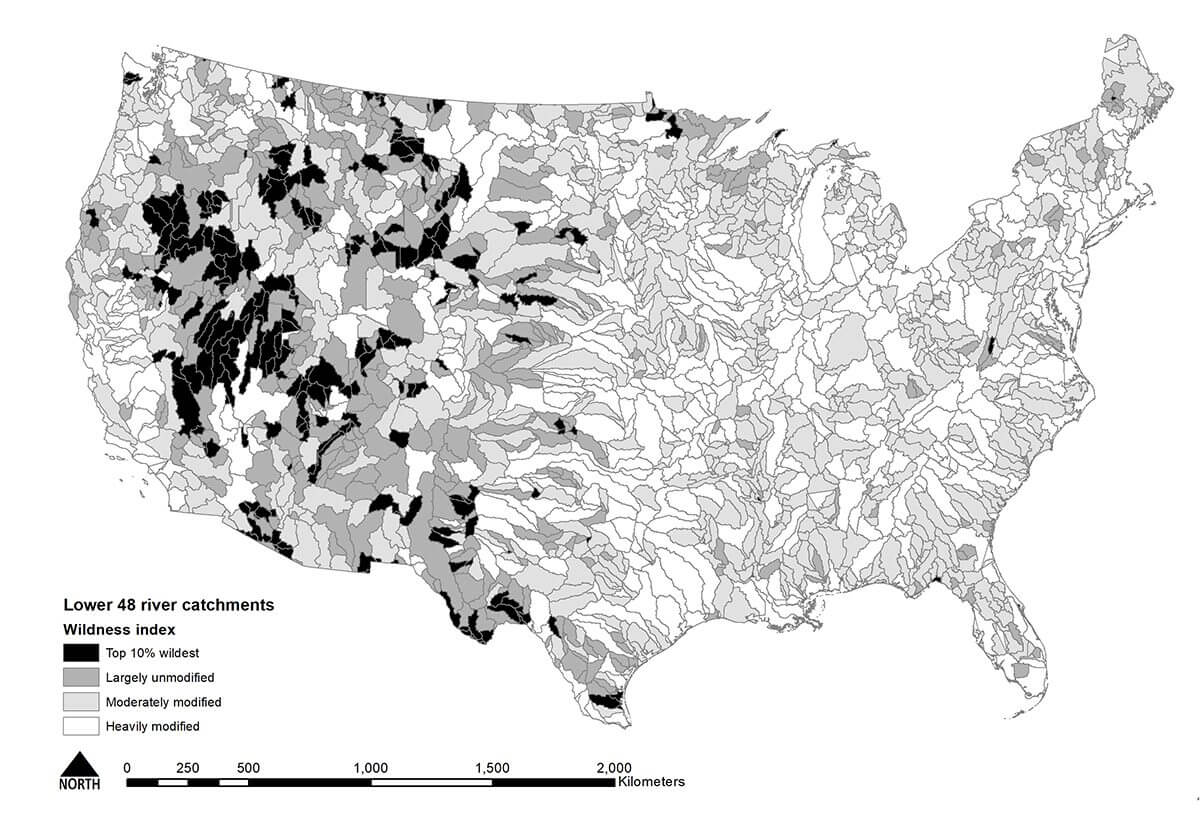
Figure 8 – Lower U.S. 48-state river catchments wildness index.
Discussion
Global datasets are generally inconsistent, coarse scale, and reliant on highly generalized data sources. This creates problems for consistent mapping at a high quality, so it is often better to map at a country scale using national datasets that, while varying in quality between countries and across national borders, will at least be internally consistent (Carver and Fritz 2016). The inconsistency and uncertainty inherent in global datasets makes continental and country-to-country comparisons difficult and open to criticism.
As the number of papers published using global datasets increases, it is important to both recognize and question the validity of the results presented. Recent examples include global analyses that purport to show catastrophic declines in wilderness areas since the early 1990s (Watson et al. 2016). While the general global trends reported are likely to be true, the quality of the data and therefore the subsequent analyses are questionable when examined in detail at the national scale and especially where reductions in human impacts are reported (http://wcshumanfootprint.org/). This is largely due to changes in the way the datasets were compiled and recorded between 1993 and 2009 and variations in the detail at which data on topics such as land use and population are recorded between countries.
The same can be said of the draft analyses presented here, as this study uses some of the same datasets (i.e., the Human Footprint version 2 database) to define spatial patterns in the variability of human impact, although here we are not trying to model change over time. The Human Footprint version 2 data relies heavily on global datasets including human population pressure (population density), human land use and infrastructure (built-up areas, nighttime lights, land use/land cover), and human access (coastlines, roads, railroads, navigable rivers), all of which are subject to generalization, leading to errors of both omission and commission. The resolution of 1-kilometer (.62 mile) grid leads to further generalization. The reliability of key datasets varies spatially between countries, particularly when relying on national census data for information on population density. Problems with the base data notwithstanding, by far the greatest cause for concern with the global analysis of wild rivers is the definition of the catchment boundaries themselves. These boundaries or watersheds can be defined for any point along the length of the river while the Hydro1k and datasets like it only provide a limited series of nested catchments. This is in effect an example of the well-known Modifiable Areal Unit Problem wherein the results of dividing the world up into a series of artificially defined reporting units can markedly influence the patterns seen in the mapped data (Openshaw 1984). The catchments provided by Hydro1K are just one set of basins out of a theoretically infinite set of possibilities, and while the local topography will determine the flow direction and the catchment watershed, the choice of pour-point above which to define the contributing area is critical in determining the shape and area of the catchment. As a result, the intersection with the human impact data and the catchment’s position in the global hierarchy of wild rivers can vary widely depending on the catchment boundary used. It is suggested that national or subnational analyses utilizing local scale data are almost certainly going to provide more reliable and robust outputs.
Conclusions
While the combination of the Hydro1k and Human Footprint Version 2 datasets using a weighted flow accumulation model works well in technical terms, there are some serious concerns about the validity of results when reported at global and continental scales. This is due to known limitations associated with global datasets, including coarse resolution, generalization, variable accuracy, and consistency across regions and national boundaries, as well as limitations in the use of fixed and arbitrarily defined catchment boundaries. As a result, it is suggested here that national and local assessments are also required and provide more detailed and reliable datasets, together with opportunity for nested analyses of variations in wildness indices along a river’s profile. Used together with local knowledge and expert appraisals, a more robust global assessment could be developed by building up national assessments across the globe. The practical logistics in validating results using local knowledge would be substantial but could be made manageable using crowd-sourcing techniques such as GeoWikis (Fritz et al. 2009) and participatory GIS models (Huck et al. 2014).
STEVE CARVER is director, Wildland Research Institute, School of Geography, University of Leeds, United Kingdom; email: s.j.carver@leeds.ac.uk, URL: www.wildlandresearch.org
References
Carver, S. J., and S. Fritz, (Eds.). (2016). Mapping Wilderness: Concepts, Techniques and Applications. Dordrecht, The Netherlands: Springer.
Fritz, S., I. McCallum, C. Schill, C. Perger, R. Grillmayer, F. Achard, F., … and M. Obersteiner.(2009. Geo-Wiki. Org: The use of crowdsourcing to improve global land cover. Remote Sensing 1(3), 345-354.
Halpern, B. S., S. Walbridge, K. A. Selkoe, C. V. Kappel, F. Micheli, C. D’Agrosa, and R. Watson.2008. A global map of human impact on marine ecosystems. Science, 319 (5865) (2008): 948-952.
Huck, J. J., J. D. Whyatt, and P. Coulton. 2014. Spraycan: A PPGIS for capturing imprecise notions of place. Applied Geography, 55: 229-237.
Ibisch, P. L., M. T. Hoffmann, S. Kreft, S., G. Pe’er, V. Kati, L. Biber-Freudenberger, … and N. Selva. 2016. A global map of roadless areas and their conservation status. Science, 354(6318): 1423-1427.
Lehner, B., C. R. Liermann, C. Revenga, C. Vörösmarty, B. Fekete, P. Crouzet, … and C. Nilsson. 2011. High‐resolution mapping of the world’s reservoirs and dams for sustainable river‐flow management. Frontiers in Ecology and the Environment, 9(9): 494-502.
Lesslie, R. and M. Maslen. 1995. National Wilderness Inventory Australia. Handbook of Procedures, Content, and Usage. Australian Heritage Commission, Canberra.
McCloskey, J. M., and H. Spalding. 1989. A reconnaissance-level inventory of the amount of wilderness remaining in the world. Ambio: 221-227.
Mitchell, B., and M. Hollick. (1993). Integrated catchment management in Western Australia: transition from concept to implementation. Environmental Management 17(6): 735-743.
NZCA. 2011. Protecting New Zealand’s Rivers. New Zealand Conservation Authority.
Palmer, T. 2017. A legacy of rivers. International Journal of Wilderness 23(2): 4-9.
Openshaw, S. 1984. The modifiable areal unit problem, CATMOG 38. In Geo Abstracts, Norwich.
Sanderson, E. W., M. Jaiteh, M. A. Levy, K. H. Redford, A. V. Wannebo, and G. Woolmer, G. (2002). The human footprint and the last of the wild: the human footprint is a global map of human influence on the land surface, which suggests that human beings are stewards of nature, whether we like it or not. BioScience 52(10): 891-904.
Stein, J. L., H. A. Nix, and J. A. Stein. 1999. The Identification of Wild Rivers: Methodology and Database Development; a Report for the Australian Heritage Commission by the Centre for Resource and Environmental Studies, Australian National University. Environment Australia.
Stein, J. L., J. A. Stein, and H. A. Nix.(2001. Wild rivers in Australia. International Journal of Wilderness, 7(1): 20-24.
Stein, J. L., J. A. Stein, and H. A. Nix. 2002. Spatial analysis of anthropogenic river disturbance at regional and continental scales: identifying the wild rivers of Australia. Landscape and Urban Planning, 60(1): 1-25.
Verdin, K. L., and J. P. Verdin. 1999. A topological system for delineation and codification of the Earth’s river basins. Journal of Hydrology 218(1): 1-12.
Watson, J. E., D. F. Shanahan, M. Di Marco, J. Allan, W. F. Laurance, E. W. Sanderson… and O. Venter. 2016. Catastrophic declines in wilderness areas undermine global environment targets. Current Biology 26(21): 2929-2934.
Wildlife Conservation Society and Center for International Earth Science Information Network. 2005. Last of the Wild Project, Version 2, 2005 (LWP-2): Global Human Footprint Dataset (Geographic). Palisades, NY: NASA Socioeconomic Data and Applications Center (SEDAC). http://dx.doi.org/10.7927/H4M61H5F. Accessed December 2016.
Read Next
December 2018
In this issue of IJW, we remember the wilderness giant Stewart “Brandy” Brandborg. Betsy Lindley, Maria Blevins, and Scott Williams discuss cultural meanings and management challenges for urban-proximate wilderness areas. David Cole documents the historical development and evolution of the Leave No Trace program. Finally, Crista Valentino highlights the emergence of new conservation leaders with the CoalitionWILD program.
Apologizing for Science-Based Decision Making in Protected Area Management
Apologizing for science promotes autocratic management that can easily be commandeered by sociopolitical agendas and bureaucratic systems.
Wilderness Giant: Stewart “Brandy” Brandborg Moves on at 93
Steward Brandborg was a phenomenal wilderness champion, the last wilderness advocate with ties to most of the founders of the modern wilderness movement.