Cumberland Island Salt Marshes. Photo credit © John Nettles.
Seasonal and Destination-Based Variation in Visitor Travel Routes in a Designated Wilderness
Science & Research
April 2021 | Volume 27, Number 1
PEER REVIEWED
ABSTRACT
As Global Positioning System technology improves, so does our ability to integrate spatiotemporal data into management efforts, including in designated wilderness areas. This study seeks to use space-time budgets, or how a visitor allocates their time as they travel through a space, to understand variation among wilderness users’ travel patterns through federally designated wilderness at Cumberland Island National Seashore (CUIS). Despite relatively similar trip lengths, visitor travel routes differed in distance traveled to a terminal campsite. Additionally, visitors in spring spent more time and covered more distance than those in any other season. Understanding seasonality and related travel patterns can provide valuable insight for effective wilderness management. Important findings include: (1) the distance traveled to a camping area is useful to determine visitors’ travel routes and space-time budgets, (2) travel patterns often vary by season, and (3) using GPS data loggers is a viable approach to study visitor travel patterns in designated wilderness.
To do so, managers must understand typical use and dispersal of visitors throughout the area, often with limited staff and associated resources. As such, it is important that management efforts are directed efficiently and effectively, whether inside or outside designated wilderness. However, little is known of how visitor travel patterns throughout a wilderness area may vary by season and intended destination. The way in which visitors allocate their time during trips to backcountry campsites can help inform managers of recreational impact levels across the area and potential damage to wilderness quality. High levels of use during sensitive seasons for wildlife (Zhou, Buesching, Newman, Kaneko, Xie, and Macdonald 2013), heavy use of trails within wilderness (Marion, Leung, Eagleston, and Burroughs 2016), and high densities of wilderness visitors (Cole and Hall 2010) are all potential detriments to wilderness quality and therefore must be assessed. Despite this, there is a lack of information on how seasonality and a visitor’s intended destination impact densities of use, general travel patterns, and time spent on specific trails.
While focused on specific implications for CUIS, this research sought to further improve the effectiveness of wilderness management beyond the seashore. We sought a deeper understanding of the factors contributing to the variation in wilderness users’ travel routes. Specifically, we identified the (a) most popular travel routes; (b) percent of time and distance spent on main roads, side roads, beaches, trails, and campgrounds; and (c) differences in travel patterns across seasons and the influence of visitors’ farthest campsite as listed on their wilderness permit.
Background
GPS Data in Park and Protected Area Management
Researchers use of Global Positioning System (GPS) technology has become commonplace over the last the decade, significantly improving the ability of researchers and managers to assess patterns of visitor use (for a review, see Riungu, Peterson, Beeco, and Brown 2018). Distributing small GPS data loggers in park and protected areas allows researchers and managers to assess travel patterns with objective data as opposed to relying on subjective visitor reports, which may have substantial error (Figure 1). The introduction of GPS units addressed this concern, providing a solution that was objective and descriptive. This drastically improved measurement accuracy, and correspondingly, methods for spatial research and analyses also improved (Hallo et al. 2012). These advances greatly benefit the field of park and protected area management in a way that is both compelling and realistic (Beeco and Brown 2013).

Figure 1 -The Canmore GT-740FL Sport GPS data logger with hand for scale.
For example, Nielson and Hovgesen (2004) used GPS locations from personal devices to record individuals’ movement over time and to identify travel routes, additional stops, and time allocated at each stop (Nielson and Hovgesen 2004). Other techniques were shown by Orellana, Bregt, Ligtenberg, and Wachowicz (2012), who used movement suspension patterns (MSPs) and generalized sequential patterns (GSPs) to analyze travel patterns. MSPs highlight where movement slows to identify potential areas of interest to visitors while GSPs illustrate the general sequence of site visitation. When combined, these patterns can help predict the flow of visitors, and when paired with other social science approaches, they can be used to develop an understanding of visitor preferences and potential environmental impacts (Orellana, Bregt, Ligtenberg, and Wachowicz 2012).
Visitor Space-Time Budgets
A substantial amount of visitor use management research within parks and protected areas has focused on the use of normative thresholds, or common ideations of acceptable conditions within the recreation experience (Manning 2011). This method is highly beneficial when determining acceptable levels of impact, desired conditions, and other aspects of visitors’ opinions. However, very rarely do these common practices incorporate the observed behavior of visitors. By incorporating visitor space-time analysis into research of parks and protected areas, managers are given insight into the decision making of visitors (Dietvorst 1995). Peterson, Perry, Brownlee, and Sharp (2020) define space-time budgets as the way in which a visitor allocates their limited time to cover a limited spatial area. Findings from space-time research may be useful in designing future infrastructure and transportation routes, such as roads or trails, as well as preparing for potential areas of heavy impact (McKercher and Lew 2004). In doing so, managers can minimize the long-term effects of human use, an important factor in managing designated wilderness (Hammitt, Cole, and Monz 2015). One approach to this analysis is to create space-time budgets, or the allocation of an individual’s time across a given space (Pearce 1988). Thus, a space-time budget can be described as an estimation of an individual’s personal schedule.
Visitor space-time budgets have been used in a wide variety of settings to understand preferences and patterns of visitors. In 2000, Balmford used space-time budgets to analyze the relative benefit of keeping large versus small animals on exhibit by estimating the amount of time zoo visitors spent at each exhibit. An additional study by Birenboim, Anton-Clavé, Russo, and Shoval (2013) used time budgets to identify distinct activity patterns among theme park visitors. Lastly, managers at Cumberland Island National Seashore used space-time budgets to identify the typical timing and patterns of frontcountry day use distribution, helping determine where to position staff and which areas may be more susceptible to impact (Peterson, Perry, Brownlee, and Sharp 2020).
Visitors determine their personal schedules (i.e., space-time budgets) by incorporating many factors into the decision-making process. Characteristics of both the destination and the visitor group are important aspects to consider (Lew and McKercher 2006). For example, a 1997 study of visitors to Cornwall, England, found that the presence of children within the group significantly altered behavior patterns (Thornton, Shaw, and Williams 1997). In addition, the past use history of a visitor group may significantly alter their current behavior; McKercher, Shoval, Ng, and Birenboim (2012) found that repeat visitors in Hong Kong were less likely to disperse throughout the area and more likely to return to the hotel between activities than were first-time visitors. Furthermore, distance decay theory posits that the relative distance to potential destinations may impact their popularity among visitors, with demand increasing until a tipping point at which it declines exponentially with increasing distances (McKercher and Lew 2003).
Given these collective findings, it is reasonable to postulate that even within a single wilderness area, individuals who elect to travel to farther destinations may use decision-making factors differently from those who elect to travel to nearer destinations. Although wilderness users often have varying outdoor recreation motivations, it may also be possible that – if decisions made throughout the trip are perceived in the same light as original decisions – those traveling to nearby destinations may travel in different ways from those traveling to farther destinations. For example, nearby travelers may choose different routes, travel at a different pace, or stop at different locations from those who choose farther destinations. When managing a park or protected area, knowledge of these variations in travel patterns can help inform management decisions such as where to position staff, how to allocate campsite permits, which trails to maintain, and what educational material to provide to visitors. Further, knowledge of visitor space-time budgets may provide insight into unwelcomed behavior such as the development of informal trails or use of unsanctioned campsites.
Seasonality of Behavior
While seasonal differences in visitation patterns have long been documented within the field of tourism and hospitality, their effects are dramatic, wherein they can impact employment, income, and overall community function (Butler 2011). Seasonal differences may even impact how tourists perceive destinations themselves. A 1997 study of visitors to Victoria, British Columbia, demonstrated that price-value perceptions are influenced by season (Murphy and Pritchard 1997). Further, weather patterns themselves may play a role in the development of an individual’s space-time budget. For example, Verbos and Brownlee (2017) developed a Weather-Dependency Framework, positing that different outdoor recreation activities are more or less “weather dependent” and that weather dependency is often influenced by seasonality and its associated weather and resulting conditions.
Outdoor recreation activity participation, decision-making, and activity adjustments are all influenced by weather, seasonal patterns, and resulting biophysical conditions. Evidence of this influence has been found across several studies and was recently cataloged by Verbos, Altschuler, and Brownlee (2018). For example, Horanont, Phithakkitnukoon, Leong, Sekimoto, and Shibasaki (2013) found that even day-to-day variations in weather conditions resulted in changes to people’s daily patterns, with differing impacts across geographic areas. It follows that large-scale, season-driven weather changes would produce similar variations in behavior. For example, seasonal variation influenced visitors at Hilton Head Island, South Carolina, whose trips differed in length of stay, reasons for visiting, and trip origin (Bonn, Furr, and Uysal 1992). Similarly, Zajchowski et al. (2020) found that the location, amount, and seasonal variation of ponding surface water at the Bonneville Salt Flats influenced visitor travel patterns across summer months.
When applying this idea of seasonality to designated wilderness, it may mean visitors weigh benefits and consequences of intrasite locations differently across seasons, resulting in different overall use patterns. Seasonal differences, then, may have significant impacts on the effectiveness of visitor management strategies and the impact on the environment. In designing effective management strategies, seasonality and seasonal differences of visitor use patterns should be illuminated and assessed.
Methods
Study Site
This study took place within the designated wilderness at Cumberland Island National Seashore along the coast of southern Georgia, USA (Figure 2). CUIS attracts visitors with diverse motivations thanks to its abundant natural, cultural, and recreational resources. This barrier island was designated as a National Seashore in 1972, opening to visitors in 1975 (Dilsaver 2004). Attractions include historic Plum Orchard Mansion, Dungeness Mansion Ruins, First African Baptist Church, five campgrounds, 20 miles (32.2 km) of undeveloped coastline, more than 50 miles (80.5 km) of hiking trails, and 9,886 acres (4,000 ha) of federally designated wilderness (Figure 3). As Cumberland Island is accessible only by boat, most visitors use a private passenger ferry that departs from St. Marys, Georgia. This service operates two to three times a day carrying no more than 150 passengers each trip, a limit that was established in 1984 and is now often reached during the peak season between March and July (Hallo et al. 2018).
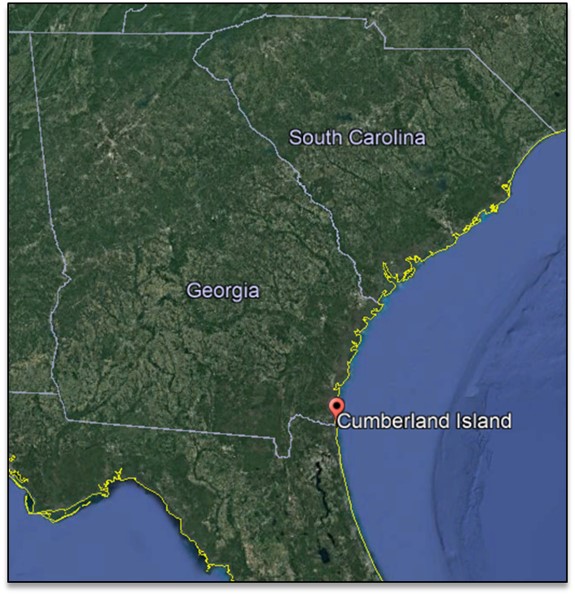
Figure 2 – Relative location of Cumberland Island National Seashore within the southeastern United States
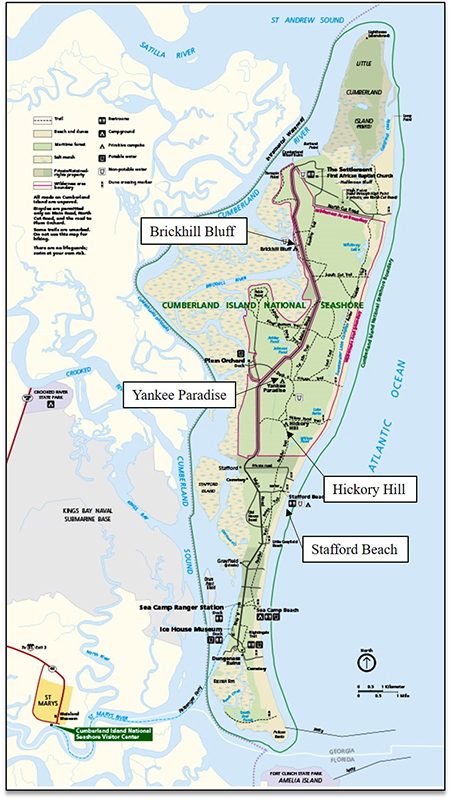
Figure 3 – National Park Service map of Cumberland Island National Seashore, with the four wilderness or backcountry campsites labeled.
The wide range of attractions on the island bring both wilderness and nonwilderness visitors (Hallo et al. 2018) with wilderness visitors attracted to the area to experience nature, solitude, and adventure. Typically spending multiple nights on the island, wilderness visitors – who make up approximately 2% of annual visitation – are responsible for paying additional fees and for obtaining a wilderness-specific permit before their visit. The southern end of the island includes several nonwilderness destinations such as the its southernmost beach, the Sea Camp Ranger Stations, and the Dungeness Ruins, all of which are frequented by both day and overnight visitors. Attractions such as Plum Orchard Mansion and the First African Baptist Church at the north end of the island, however, are surrounded by designated wilderness. Because of this fact, they are relatively inaccessible to most users (NPS 2019), for whom the distance between the ferry terminal and these attractions is too great to walk within a single day.
CUIS offers five distinct campgrounds, four of which are a greater distance from the park’s entry point than the typical destinations of nonwilderness visitors. Three of these four are within federally designated wilderness. Sea Camp Campground is the most developed campground and is easily accessible from Sea Camp Ranger Station, the main entry point on the island where the ferry disembarks passengers. Stafford Beach Campground (SB) is on the border of federally designated wilderness but offers fewer amenities than Sea Camp campground. Hickory Hill (HH), Yankee Paradise (YP), and Brickhill Bluff (BB) Campgrounds are all within federally designated (Figure 4). The campgrounds are officially listed as 0.5, 3.5, 5.5, 7.5, and 10.5 (.8, 5.6, 8.8, 12.1, and 16.9 km) miles away, respectively, from Sea Camp Ranger Station; however visitors may reach each campground a number of ways, including along the main road bisecting the wilderness area, on the beach, and on hiking trails. These overnight visitors reserve their camping permits, selecting specific campsites of their choice, up to six months in advance using the website www.recreation.gov. Each campsite accommodates up to six people with approximately four campsites at each wilderness campground. Dispersed camping outside designated sites is prohibited, and overnight campers cannot change the sites or dates on their permit once starting their trip.
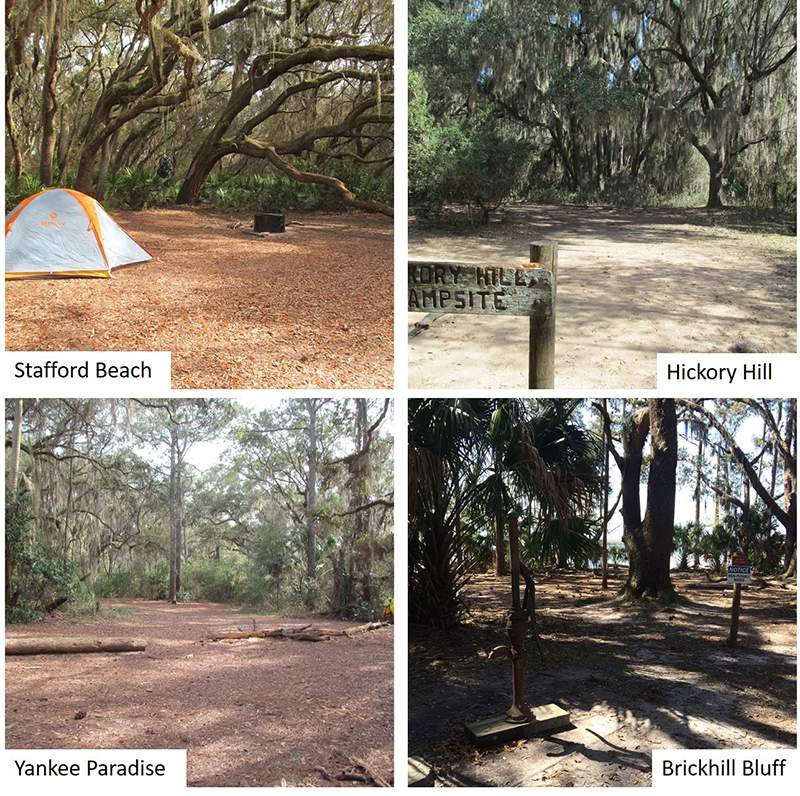
Figure 4 – Photos of each wilderness or backcountry campsite, provided by the National Park Service.
Data Collection and Analysis
At CUIS there are backcountry/wilderness campers as well as frontcountry (i.e., nonwilderness) campers. This study focused only on overnight use of backcountry and wilderness campsites, and as such does not include overnight frontcountry users staying at Sea Camp Campground. Researchers used a stratified random sample (stratified across time, day of the week, and season; Vaske 2008) and entrance intercepts to administer Canmore GT-740FL Sport GPS data loggers to all visitors that held an NPS wilderness permit and intended to travel and camp in the wilderness area. The sampling ensured that all overnight wilderness and backcountry visitors had equal probability of being sampled during our sampling period. Sampling was stratified across seasons and occurred over six weeks in 2018 during the last two weeks in March (spring), two weeks at the end of July (summer), and two weeks in October (fall). Upon agreement to participate, researchers provided a GPS data logger to these overnight wilderness users to carry during their visit. If a researcher was not present upon visitors’ return to the Sea Camp Ranger Station, they were instructed to place the data logger in a specified drop box for later retrieval.
These data loggers have been used successfully in several parks and protected areas, including CUIS and Denali National Park & Preserve and showed relatively high accuracy, durability, and ease of use (Peterson et al. 2020; Stamberger et al. 2018). The Canmore GT-740FL has a long battery life and allows for little device tampering due to the lack of an LCD screen and the presence of few buttons. These data loggers – which only receive, and do not transmit data – recorded latitude/longitude waypoints every 15 seconds and were only analyzed after being returned to the research team (Hallo et al. 2012; D’Antonio, Monz, Lawson, Newman, Pettebone, and Courtemach 2010). After downloading the logger data into MS Excel, the researchers performed an initial data cleaning prior to opening it in ArcMap.
Once in ArcMap, the trackers’ geospatial data was analyzed for technical errors using steps outlined by Beeco and Brown (2013). These factors were largely based on physical feasibility, including distance between adjacent waypoints, acceptable level of error, and possibility of travel routes. The cleaned data for these routes were then merged by season and farthest campsite to create density maps of travel patterns, excluding time spent at attraction points. Each route was also analyzed individually using the attribute table in ArcMap and MS Excel to determine characteristics such as trip length, distance traveled, and percent of time spent on the main road, side roads, beaches, trails, and campsites. Whereas beaches, trails, and campsites are within the wilderness area, main roads and side roads bisect wilderness but are excluded.
The measured attributes were then compared using a one-way analysis of variance (ANOVA) and least significant difference (LSD) post hoc test in SPSS v24.0. For such analyses, dependent variables were time (minutes) and distance (miles), whereas independent variables were location of travel (e.g., main road, beach, trail), farthest campsite, and season (i.e., fall, summer, spring). For these comparisons, statistical assumptions were met, including assurance of no statistical outliers as detected by box plots, independence of observations, normal residuals (Shapiro-Wilk’s test), and homogeneity of variances (Leven’s test, or a correction for nonpooled variances when appropriate). An alpha (α) level of 0.05 was used for all statistical tests and eta-square η2 was used as one interpretation of effect size for significant differences. Cohen (1988) and Ferguson (2016) suggest that approximately 0.01 indicates a small effect size, while 0.06 is medium, and 0.14 is large. However, even small effect sizes can have substantial implications for practice and theory (Fidler and Cumming 2013).
Results
Over the course of three seasons (spring, summer, and fall), researchers approached 82 wilderness groups at the beginning of their CUIS experience, 70 of which elected to participate, yielding an 85% response rate. The average size of eligible groups was 5.6 people. The analysis includes visitors to four of the five campsites (Stafford Beach, Hickory Hill, Yankee Paradise, and Brickhill Bluff). Although Stafford Beach is not within designated wilderness, it requires the same permit process and backpacking methods as the three wilderness campsites so was included in the analysis.
On average, wilderness visitors spent 79% of their total trip time at their campsites. Total trip time includes travel time on the island, time spent at attraction points (e.g., Plum Orchard Manion, Dungeness Ruins, the beach), and nights (Table 1). The remaining time was spent actively traveling, with 11% of time on trails, 5% on main roads, and approximately 2% on side roads and on the beach. In terms of distance traveled, 54% of the total distance traversed by wilderness visitors occurred on trails, 28% on main roads, and approximately 9% on side roads and the beach.

Table 1 – Average use of travel routes across all seasons and campgrounds. *Note: Superscripts represent significant differences across travel types (p<0.05). “Overall” does not include time and distance while at attractions.
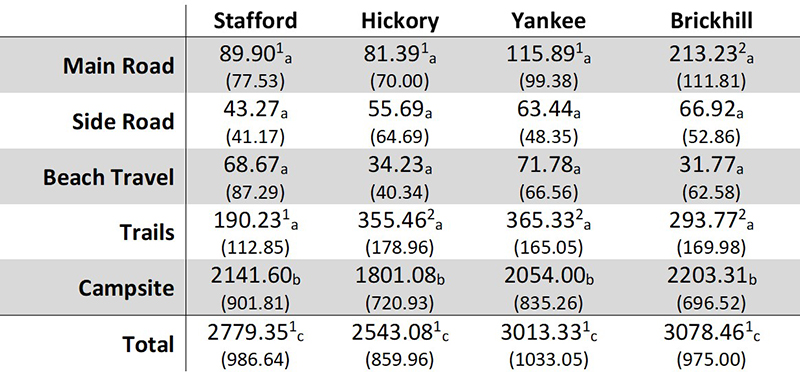
Table 2 – Comparison of mean (SD) time (minutes) spent on various travel routes by farthest campsite. *Note: Superscripts represent statistically significant differences across campsites at the .05 level. Subscripts represent statistically significant differences across travel types at the .05 level. Totals include time while at destinations.
Travel Routes by Farthest Campsite
Of the 70 wilderness groups, 47% of users chose Stafford Beach as their farthest campsite while approximately 15% chose Yankee Paradise, 20% chose Hickory Hill, and 20% chose Brickhill Bluff. Visitors to Brickhill Bluff used the main road for significantly more time (M = 213.23 minu tes, SD = 111.81), F(3,62) = 7.10, p < .001, η2 = 0.256 and dis tance (M = 12.19 miles, SD = 8.46), F(3,62) = 7.65, p < .001, η2 = .270 than did o ther groups (Tables 2 and 3). Stafford Beach visitors used trails for significantly less time (M = 190.84 minu tes, SD = 111.00), F(3,62) = 5.92, p = .001, η2 = .223 and distance (M = 7.95 miles, SD = 4.61), F(3,62) = 8.16, p < .001, η2 = .283 than did o ther groups. In addition, distance spent on side roads generally increased with farther campsites, F(3,62) = 3.26, p = .03, η2
= .270 while time on side roads, F(3,62) = .77, p = .51, η2 = .036 did not.
Further, total trip time did not differ significantly, F(3,62) = 0.82, p = .49, η2 = .038 by farthest campsite and while total distance traveled was significantly less for Stafford Beach visitors (M= 25.05 miles, SD = 9.27), F(1,6 3) = 21.21, p < .001, η2 = .277 than all other backcountry/wilderness campers, it did not differ significantly between the remaining three sites (M = 38.54 miles, SD = 13.55), F(2,32) = .78, p = .47, η2 = .069. (Figure 5) Visitors to Stafford Beach were unique in that they spent most of the day at the beach, and their use was highly concentrated in this area of the island, seldom visiting popular attractions farther north.
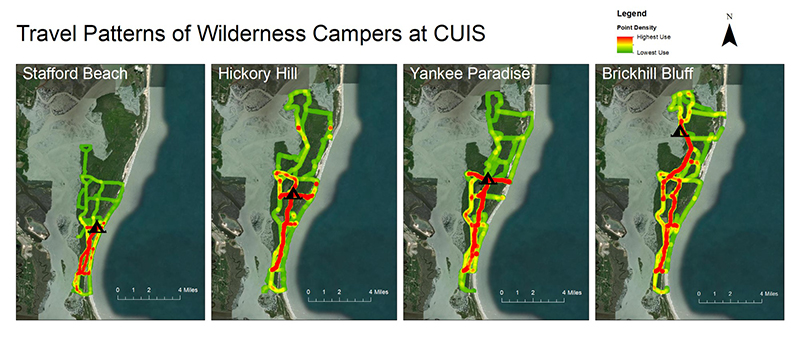
Figure 5 – Heat maps of travel routes by farthest campsite visited.
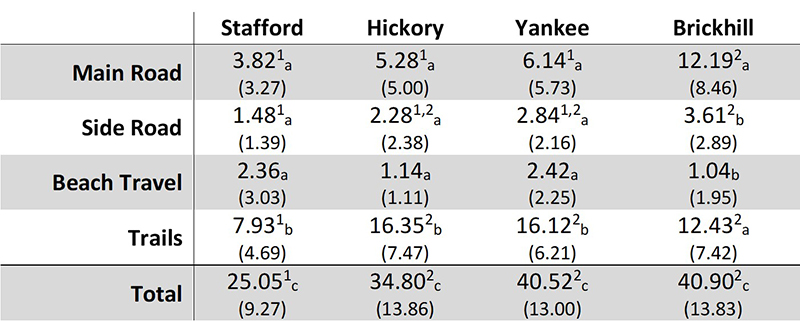
Table 3 – Comparison of mean (SD) distance (miles) traveled on various travel routes, by farthest campsite. *Note: Superscripts represent statistically significant differences across campsites at the .05 level. Subscripts represent statistically significant differences across travel types at the .05 level. Totals include distance while at destinations.
Travel Routes by Season
Of the 70 respondent groups, 31 visited in the spring, 18 visited in the summer, and 17 visited in the fall. Despite insignificant results of the ANOVA, F(2,63) = 2.80, p = .069, η2 = .082, campsite selection differed significantly between spring and fall (p = .02), with 35.5% listing Stafford Beach as the farthest campsite in spring and 64.7% listing Stafford beach in the fall. Total trip time, F(2,67) = 3.33, p = .004, η2 = .090 and total distance traveled were both significantly greater in spring (M = 3083.23 minutes, SD = 953.44; M = 37.43 miles, SD = 12.51) than in summer (M = 2442.86 minutes, SD = 948.33; M = 26.99 miles, SD = 9.50)(Tables 4 and 5). Visually, visitors to all campsites appear to be much more concentrated along the beach in the spring and fall than in the summer. Lastly, distance, F(2,67) = 4.69, p = .012, η2 = .123 and time, F(2,67) = 3.29, p = .043, η2 = .089 on trails were both significantly greater in spring (M = 314.48 minutes, SD = 169.53; M = 13.98 miles, SD = 7.36) than in fall (M = 200.11 minutes, SD = 130.79; M = 8.55 miles, SD = 5.18) (Figure 6).
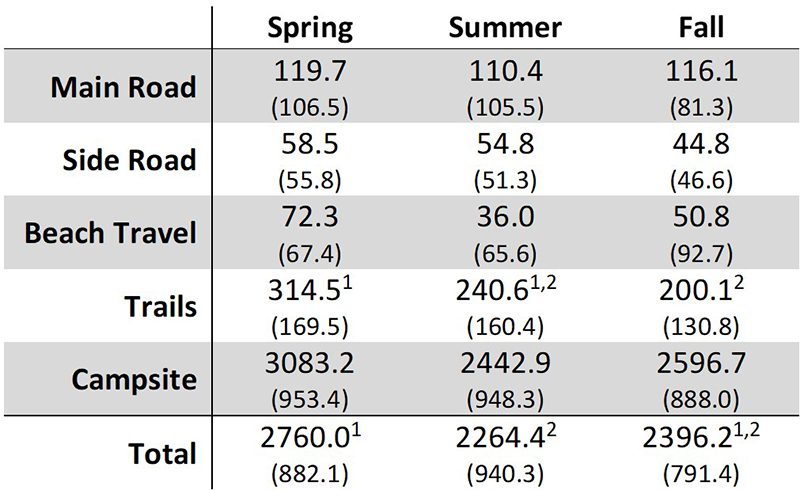
Table 4 – Comparison of mean (SD) time (minutes) spent on various travel routes, by season of use. *Note: Superscripts represent statistically significant differences across seasons at the .05 level. Totals include time while at destinations. campsites at the .05 level. Subscripts represent statistically significant differences across travel types at the .05 level. Totals include time while at destinations.
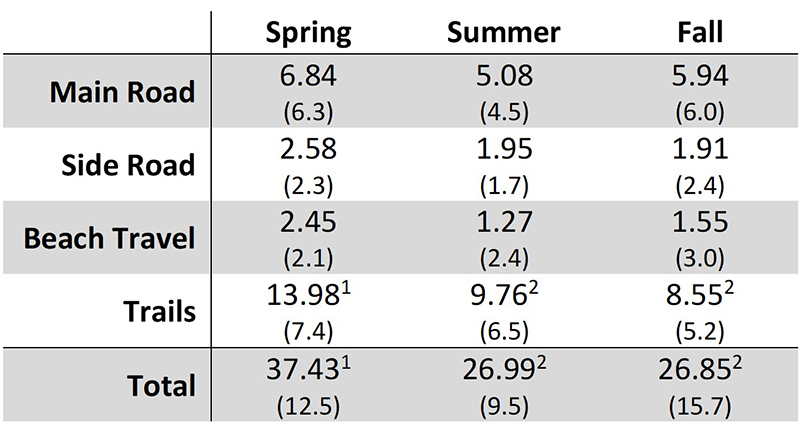
Table 5 – Comparison of mean (SD) distance (miles) traveled on various travel routes, by season of use. *Note: Superscripts represent statistically significant differences across seasons at the .05 level. Totals include distance while at destinations.
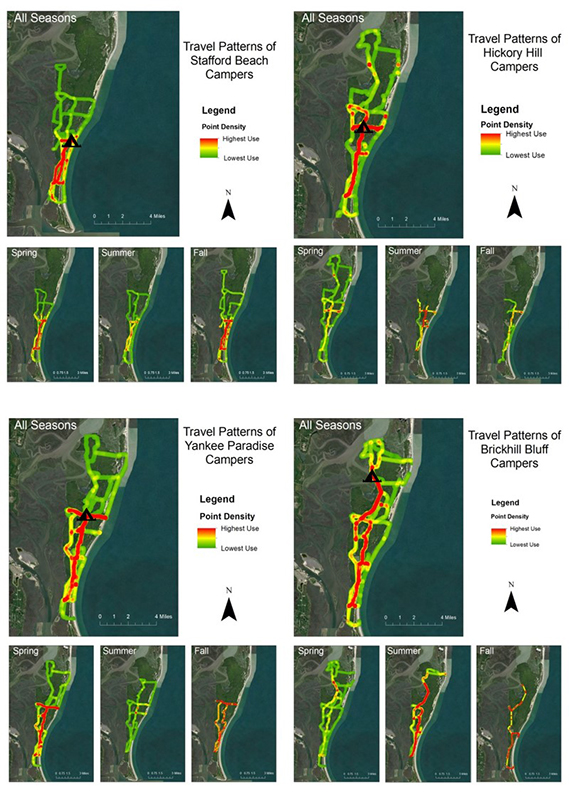
Figure 6 – Heat maps of travel routes by season and farthest campsite visited.
Summary and Discussion
Annual visitation at Cumberland Island National Seashore has increased dramatically since the establishment of a General Management Plan in 1984, placing additional pressure on its designated wilderness. To best understand visitor impacts throughout this large wilderness area, managers required information on visitor dispersal, including travel routes and patterns. However, little was known of visitor use beyond a few popular frontcountry sites. Our research addressed this knowledge gap by providing managers information regarding the travel patterns of wilderness visitors to CUIS and variations across seasons and farthest campsite. Use of trails, main roads, and side roads all differed by farthest campsite, whereas total trip length was consistent across all backcountry/wilderness visitors, and total distance traveled was consistent across visitors to all campsites beyond Stafford Beach. As a result, differences in travel patterns can be attributed to differences in route choices rather than simply campsite location.
Despite traveling to a wilderness campsite, backcountry visitors spent a surprisingly large amount of time along the main road. Those visiting Brickhill Bluff, the farthest campsite from Sea Camp Ranger Station, traveled nearly as far along main roads as they did on wilderness trails. Aside from the section of trail between Stafford Beach and Yankee Paradise, a large majority of travel through the wilderness area was along the road that actually bisects it. This is most likely the easiest path but lacks many of the characteristics of a wilderness experience. Not only is it a straight road with vehicles occasionally driving by, the heavy use of roads by backcountry/wilderness visitors could lead to feelings of crowding and lack of solitude.
This descriptive research provides a starting point for managers at CUIS to understand visitor use patterns throughout the wilderness area, outlining high use corridors, and determining areas of potential management concern.
Although slightly less informative, backcountry/wilderness visitors selected campsites in different proportions across seasons and typically traveled for greater time and distance in the spring than in the summer or fall. This is likely due to the hot and humid weather at CUIS during the summer and early fall. Further, this increased time and distance seem to be accounted for by increased travel on trails. Since most trail travel occurred between Stafford Beach and Yankee Paradise, this approximately 4-mile (6.4 km) portion of trail may be at high risk of crowding during the spring season. If this is the case, further limits might be put on the number of visitors allowed to camp at the same time beyond Stafford Beach. Seasonal weather might also play a role as lower temperatures during the spring season may create a more comfortable environment along the trails than summer or early fall conditions. Thinning of brush along the trail may be a potential way to encourage visitors to use trails, even during warmer weather.
While these differences are not useful in predicting patterns, they do provide valuable insight into travel route variation at CUIS, and in general, differing by both end destination and season of use. This descriptive research provides a starting point for managers at CUIS to understand visitor use patterns throughout the wilderness area, outlining high use corridors, and determining areas of potential management concern. Future research could use GPS data loggers coupled with surveys or interviews to understand other interpersonal or intrapersonal factors (e.g., motivations to visit, desired benefits, past use history) that may contribute to travel patterns, route selection, and resource degradation. Research is also needed to assess the relationship between travel route and the quality of a wilderness experience, including the impact of road travel rather than trail use at CUIS.
We recommend managers of all applicable backcountry/wilderness areas consider the following ideas and methods in maintaining meaningful wilderness experiences.
- Pay attention to visitors’ farthest destination as a primary point of information and contributing factor to identify travel routes and space-time budgets.
- Travel patterns likely differ across seasons, and effective management strategies should reflect this potential seasonal variation in travel behavior.
- Research on visitor travel patterns should be revisited regularly to monitor for trends and potential problem areas, improving the efficacy of management efforts.
- Distributing GPS data loggers is a relatively cost-effective mechanism to understand travel patterns, densities, and use in designated wilderness.
This study of wilderness and backcountry visitors at CUIS provides further evidence for the benefit of spatially or seasonally segmenting user groups. This research approach provides important insights into how the designated wilderness and associated backcountry areas are used at Cumberland Island National Seashore. Furthermore, the approach is transferrable to similar wilderness areas and backcountry settings where understanding visitor travel patterns may help inform management decisions.
Acknowledgments
The views expressed in the article are the responsibility of the authors and do not necessarily represent the opinions or policies of the US National Park Service. Funding for this project was provided by the US National Park Service, associated with the Cooperative Agreement No. P16AC00449, facilitated through the Cooperative Ecosystem Studies Units. We would like to acknowledge the CUIS staff for their support and collaboration
About the Authors
JOHN NETTLES is a graduate of the Park Solutions Lab within Clemson University’s Department of Parks, Recreation, and Tourism Management; email: nettle2@g.clemson.edu.
DR. MATT BROWNLEE is an associate professor in the Park Solutions Lab within Clemson University’s Department of Parks, Recreation, and Tourism Management; email: mbrownl@clemson.edu.
DR. RYAN SHARP is an associate professor in the Applied Park Science Lab within Kansas State University’s Park Management and Conservation Program; email: ryansharp@ksu.edu.
DR. MICHAEL BLACKETER is a graduate of the Park Solutions Lab within Clemson University’s Department of Parks, Recreation, and Tourism Management; email: mblacke@g.clemson.edu.
DR. BRIAN PETERSON is a postdoctoral fellow in the Applied Park Science Lab within the Park Management and Conservation program at Kansas State University; email: brianpeterson@ksu.edu.
References
Beeco, J. A., and G. Brown. 2013. Integrating space, spatial tools, and spatial analysis into the human dimensions of parks and outdoor recreation. Applied Geography 38: 76–85.
Birenboim, A., S. Anton-Clavé, A. P. Russo, and N. Shoval. 2013. Temporal activity patterns of theme park visitors. Tourism Geographies 15(4): 601–619.
Bonn, M. A., H. L. Furr, and M. Uysal. 1992. Seasonal variation of coastal resort visitors: Hilton Head Island. Journal of Travel Research 31(1): 50–56.
Butler, R. 2011. Seasonality in Tourism: Issues and Implications. New York: Routledge.
Cohen, J. 1988. Statistical Power Analysis for the Behavioral Sciences. New York: Routledge Academic.
Cole, D. N., and T. E. Hall. 2010. Experiencing the restorative components of wilderness environments: Does congestion interfere and does length of exposure matter? Environment and Behavior 42(6): 806–823.
D’Antonio, A., C. Monz, S. Lawson, P. Newman, D. Pettebone, and A. Courtemanch. 2010. GPS-based measurements of backcountry visitors in parks and protected areas: Examples of methods and applications from three case studies. Journal of Park and Recreation Administration 28(3): 42–60.
Dietvorst, A. G. J. 1995. Tourist behaviour and the importance of time-space analysis. Tourism and Spatial Transformations: 163–181.
Dilsaver, L. M. 2004. Cumberland Island National Seashore: A History of Conservation Conflict. Charlottesville: University of Virginia Press.
Ferguson, C. J. 2016. An effect size primer: A guide for clinicians and researchers. In Methodological Issues and Strategies in Clinical Research, ed. A. E. Kazdin (pp. 301–310). American Psychological Association.
Fidler, F., and G. Cumming. 2013. Effect size estimation and confidence intervals. In Handbook of Psychology: Research Methods in Psychology, ed. J. A. Schinka, W. F. Velicer, and I. B. Weiner (pp. 142–163). Hoboken, NJ: John Wiley & Sons Inc.
Hallo, J. C., J. A. Beeco, C. Goetcheus, J. McGee, N. G. McGehee, and W. C. Norman. 2012. GPS as a method for assessing spatial and temporal use distributions of nature-based tourists. Journal of Travel Research 51(5): 591–606.
Hallo, J., M. Brownlee, M. Hughes, J. Fefer, and R. Manning. 2018. The experiential carrying capacity of a barrier island: A norm-based approach at Cumberland Island National Seashore. Tourism in Marine Environments 13(2):DOI: 10.3727/154427318X15276699095989.
Hammitt, W. E., D. N. Cole, and C. A. Monz. 2015. Wildland Recreation: Ecology and Management. Chichester, UK: Wiley-Blackwell.
Horanont, T., S. Phithakkitnukoon, T. W. Leong, Y. Sekimoto, and R. Shibasaki. 2013. Weather effects on the patterns of people’s everyday activities: A study using GPS traces of mobile phone users. PloS One 8(12): e81153.
Interagency Visitor Use Management Council. 2019. Visitor Capacity Guidebook. https://visitorusemanagement.nps.gov/VUM/Framework.
Lew, A., and B. McKercher. 2006. Modeling tourist movements: A local destination analysis. Annals of Tourism Research 33(2): 403–423.
Manning, R. E. 2011. Studies in Outdoor Recreation, 3rd ed. Corvallis, OR: Oregon State University Press.
Marion, J. L., Y. F. Leung, H. Eagleston, and K. Burroughs. 2016. A review and synthesis of recreation ecology research findings on visitor impacts to wilderness and protected natural areas. Journal of Forestry 114(3): 352–362.
McKercher, B., and A. A. Lew. 2003. Distance decay and the impact of effective tourism exclusion zones on international travel flows. Journal of Travel Research 42(2): 159–165.
———. 2004. Tourist flows and the spatial distribution of tourists. A Companion to Tourism: 36–48.
McKercher, B., N. Shoval, E. Ng, and A. Birenboim. 2012. First and repeat visitor behaviour: GPS tracking and GIS analysis in Hong Kong. Tourism Geographies 14(1): 147–161.
Murphy, P. E., and M. Pritchard. 1997. Destination price-value perceptions: An examination of origin and seasonal influences. Journal of Travel Research 35(3): 16–22.
National Park Service. 2019. Cumberland Island National Seashore (US National Park Service). https://www.nps.gov/cuis/index.htm.
Nielson, T. S., and H. H. Hovgesen. 2004. GPS in pedestrian and spatial behavior. Paper for Cities for People, The Fifth International Conference on Walking in the 21st Century, Copenhagen, Denmark.
Orellana, D., A. K. Bregt, A. Ligtenberg, and M. Wachowicz. 2012. Exploring visitor movement patterns in natural recreational areas. Tourism Management 33(3): 672–682.
Pearce, D. G. 1988. Tourist time-budget. Annals of Tourism Research 15(1): 106–121.
Peterson, B., E. Perry, M. Brownlee, and R. Sharp. 2020. The transient nature of concentrated use at a national park: A spatiotemporal investigation into visitor behavior. Journal of Outdoor Recreation and Tourism 31: 100310.
Riungu, G. K., B. A. Peterson, J. A. Beeco, and G. Brown. 2018. Understanding visitors’ spatial behavior: A review of spatial applications in parks. Tourism Geographies 20(5): 833–857.
Stamberger, L., C. J. van Riper, R. Keller, M. Brownlee, and J. Rose. 2018. A GPS tracking study of recreationists in an Alaskan protected area. Applied Geography 93: 92–102. DOI: 10.1016/j.apgeog.2018.02.011.
Thornton, P. R., G. Shaw, and A. M. Williams. 1997. Tourist group holiday decision-making and behaviour: The influence of children. Tourism Management 18(5): 287–297.
Vaske, J. J. 2008. Survey Research and Analysis: Applications in Parks, Recreation, and Human Dimensions.
State College, PA: Venture.
Verbos, R., and M. Brownlee. 2017. The weather-dependency framework (WDF): A tool for assessing the weather dependency of outdoor recreation activities.Journal of Outdoor Recreation and Tourism 18: 88–99. DOI: 10.1016/j.jort.2017.02.005.
Verbos, R., B. Altschuler, and M. Brownlee. 2018. Weather studies in outdoor recreation and nature-based tourism: A research synthesis and gap analysis. Leisure Sciences 40(6): 533–556. DOI: 10.1080/01490400.2017.1325794.
Zajchowski, C., M. Brownlee, M. Blacketer, B. Peterson, K. Craft, and B. Bowen. 2020. Rapid resource change and visitor use management: Social-ecological connections at the Bonneville Salt Flats. Environmental Management 66(2): 263–277. DOI: 10.1007/s00267-020-01309-1.
Zhou, Y., C. D. Buesching, C. Newman, Y. Kaneko, Z. Xie, and D. W. Macdonald. 2013. Balancing the benefits of ecotourism and development: The effects of visitor trail-use on mammals in a Protected Area in rapidly developing China. Biological Conservation 165: 18–24.
Read Next

Protected Areas in a Post-Pandemic World
I am excited that 2021 brings us the 27th volume of the International Journal of Wilderness, and with is comes new beginnings.
Interpreting John Muir’s Legacy
In judging Muir’s legacy, we should be compelled to look inward, admit our own shortcomings, and acknowledge that we, too, have been participants in a system that oppresses Black Americans, Indigenous peoples, and other people of color.

The Curse of the Wild Horses: Deromanticizing Feral Horses to Save Australia’s Kosciuszko National Park
This article documents two walks in the Byadbo Wilderness Area of Australia’s Kosciuszko National Park that revealed inordinate numbers of feral horses, whose population has increased rapidly despite ongoing drought and consequent environmental damage