Recreational use on wilderness rivers.
In Search of Solitude: A Case Study of Wilderness and Nonwilderness River Users
Science & Research
December 2020 | Volume 26, Number 3
PEER REVIEWED
ABSTRACT According to a 2016 report by the US Forest Service, national visitation in designated wilderness has been steadily rising since 2007, which raises the question: What are the social conditions desired by the public in designated wilderness? Responses from a sample of river users (n = 344) in wilderness (n = 190) and nonwilderness (n = 154) sections of a national river in the southeast United States helped address this question. The results revealed that even though wilderness visitors experienced substantially higher use levels than nonwilderness users, their acceptability scores for different levels of use were not significantly different.
The popularity of outdoor recreation has grown in the past few decades, with many sites experiencing a significant increase in visitation since 2010 (National Park Service 2019). With annual visitation to US national parks surpassing 300 million people (National Park Service 2019), unintended impacts to both the recreation resource and the visitor experience can occur (Manning 2011). In many cases, visitors might experience spatial and/or temporal displacement (e.g., recreating at different times or locations) due to undesirable social and resource conditions (Cribbs et al. 2019; Fefer 2019). For instance, visitors seeking solitude may choose to visit federally designated wilderness, rather than a more developed, front-country, recreation site (Manning 2013).
It was not until the inception of the Wilderness Act (1964) and the creation of the National Wilderness Preservation System (NWPS) that managers and researchers began monitoring wilderness-based recreation for adherence to legislative mandates for solitude and unconfined recreation. A 1996 report stated that the NWPS saw a six-fold increase in visitation in its first 30 years of designation (Cole 1996). According to a more recent study by the US Forest Service (2016), national visitation in designated wilderness has been steadily rising since 2007, marked by an increase of almost 17%.
Wilderness areas were designed to preserve natural and untrammeled conditions and to provide outstanding opportunities for solitude and/or primitive and unconfined recreation (Wilderness Act 1964). With the consistent rise in wilderness visitation, one prominent question continues to deserve investigation: What are the social conditions desired by the public in designated wilderness? The concept of social norms and the tenets of normative theory help answer questions about desired conditions (Manning 2011; IVUMC 2016). In the context of parks and protected areas, norms are considered visitors’ shared beliefs about appropriate conditions or human behavior in a protected area (e.g., level of crowding). Norms can be measured by identifying indicators of quality and developing quantifiable thresholds of acceptability for certain conditions, as reported by the visiting population. Indicators are measurable and manageable variables that help define the quality of a recreation experience, whereas a threshold represents the minimum acceptable condition of an indicator (IVUMC 2016).
In terms of wilderness-related norms, Shelby (1981) asked visitors what they felt was the appropriate encounter levels with other recreation groups for three different outdoor settings. Between the three outdoor settings (wilderness, semiwilderness, and undeveloped recreation), visitors reported that wilderness should have the least number of encounters per trip. A similar finding was revealed by Hallo et al. (2018) at Cumberland Island National Seashore, where visitors to designated wilderness desired fewer people at attraction sites on the island than nonwilderness visitors. Traditionally, studies have revealed that visitors generally report that wilderness should host the lowest number of encounters, and wilderness users have been found to possess different motivations and desired outcomes compared to nonwilderness users, such as the desire to experience unconfined recreation and solitude (Basman et al. 1996; Brownlee and Hallo 2013; Donnelly et al. 2000; Stankey 1980; Stankey et al. 1984).
However, research has also documented shifts in how wilderness is being used, and who is visiting designated wilderness. For example, a study of National Park Service wilderness managers estimates that as many as half of all wilderness visitors are day users, and that day users’ motivations and expectations differ substantially from more conventional overnight wilderness visitors (Abbe and Manning 2007; Hallo and Manning 2010). As another example, Hallo and Manning (2010) demonstrated that some park visitors enjoy viewing the landscape of designated wilderness from the comfort of vehicles without venturing into a wilderness area. This documented shift begs the question: What are the social conditions desired by the public in designated wilderness? Furthermore, this question extends to wilderness in a river-based system, which may offer an even more unique perspective on the issue.
Although there have been many studies about management of wilderness for solitude conditions, most of this work occurred before recent increases in visitation and potential shifts in user-type, motivations, or visitors’ conceptualizations of wilderness (Hallo and Manning 2010). Historically, recreation research tends to combine both wilderness and nonwilderness users when examining use-level-related norms, but few have focused on the implications that use levels may have on wilderness visitors in a river-based system (Manning et al. 2000; Manning 2003). Therefore, we investigated if river users’ expectations and thresholds for use levels differed between those recreating in designated wilderness or nonwilderness sections of the same river. Four hypotheses, underpinned by elements of the 1964 Wilderness Act and findings from previous empirical studies, guided our work:
- Wilderness users will have lower acceptability ratings for high use conditions than non-wilderness users,
- Wilderness users will report experiencing fewer encounters with other boaters than nonwilderness users,
- Wilderness users will report experiencing less crowding, and
- The conditions experienced by wilderness and nonwilderness users will not influence their acceptability ratings for different use levels.
Ultimately, this study was designed to help explain if wilderness visitors differ from nonwilderness visitors in desired conditions related to use levels and potential crowding. Additionally, we explored if management action may be needed to adhere to wilderness values defined by both legislation and visitor opinion.
Methods
Study Area
We conducted this study, focused on day-use river users (i.e., boaters), in both federally designated wilderness and nonwilderness sections of the same national river in the southeast United States. This river offers more than 100 miles (161 km) of free-flowing water surrounded by karst topography, undeveloped viewsheds, and river bluffs that exceed 400 feet (122 m) in some locations. There are few roads that parallel the river, but boaters access the river by using well-documented and managed access areas. In both the wilderness and nonwilderness river sections, management does not limit the number of boaters allowed on the river at one time. Use levels are indirectly influenced by concessionaire availability and seasonal water levels. Roughly one-third of the river and its riparian area is within or adjacent to federally designated wilderness.
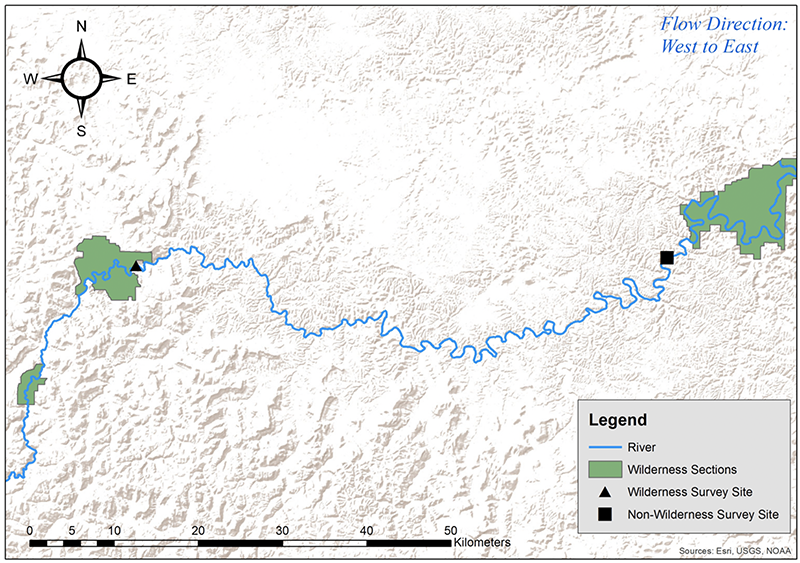
Figure 1 – Map of research site and survey locations.”
We present the following as an empirically grounded opportunity to reflect on questions of visitor use and preferences inside and outside of wilderness, rather than as an examination or critique of management at a particular wilderness site. To maintain focus on our research questions and what the results may contribute to the conversation of visitor preferences and standards of wilderness character, we have chosen to refrain from naming the specific site or associated identifiers.
Sampling Design
We used two survey stations to capture both wilderness and nonwilderness users. The first survey station was positioned at a river access point where boaters would exit the river after having floated at least 13 river kilometers (8 miles) directly through designated wilderness (i.e., wilderness users). The second survey station was selected at another river access point where, given its substantial downstream distance from designated wilderness, it was highly unlikely that any day-use boaters would have encountered designated wilderness sections (i.e., nonwilderness users) (Figure 1).
Regarding instrumentation, we used standard visual methods embedded in the quantitative survey consistent with methodological procedures reported in previous studies (Stankey 1980; Hallo et al. 2018; Hallo and Manning 2010). Sampling occurred in 2016 and 2017 during peak season, April through October, simultaneously at the two survey stations to intercept wilderness and nonwilderness users. Sampling was stratified by time of the day, day of the week, and week of the season. All respondents were >18 years old and selected via nonprobability sampling. After finishing their river experience, respondents at both intercept sites completed a self-administered survey containing questions regarding a series of five photographs representing varying numbers of boats at one time on the river (BAOT; Figure 2). Respondents rated the acceptability of the conditions in each photograph on a scale ranging from very unacceptable (-4) to very acceptable (+4). Surveys were administered with Samsung Galaxy TabA® tablets using Qualtrics® survey software. The series of five 8” X 10” digitally edited photographs ranged from zero BAOT (solitude condition) to 24 BAOT (saturated conditions) and were displayed in a photo binder viewed by each respondent. The level of BAOT depicted in each photograph series reflected a range of current or potential conditions verified by park managers.
In addition to questions regarding BAOT, respondents rated their level of acceptability for visitor encounters per hour while boating on the river (six conditions presented: 0, 20, 40, 60, 80, and 100 encounters per hour). Visitors also responded to questions regarding other evaluative dimensions of use levels and potential crowding, such as the BAOT condition or an encounter rate that (a) they experienced during their visit (experienced condition), (b) requires management action, (c) would lead to no longer using the site (displacement), and (d) is so high that visitor use should be limited. Survey response completion times ranged from 10–15 minutes.
Analysis
Using statistical software package SPSS® (v. 24), we generated descriptive statistics and used a series of independent samples t-tests and chi-square tests of homogeneity to assess if boaters’ thresholds for BAOT, visitor encounter rates, perceived level of crowding, and demographics differed significantly (p < 0.05) between wilderness and nonwilderness users. Additionally, we used the Potential for Conflict Index (PCI2) to determine if the two user groups possessed agreement relative to acceptability scores and associated norms (i.e., norm crystallization) (Vaske and Shelby 2008). The PCI2 index spans from zero (maximum agreement; or potentially well-developed norms) to one (minimal agreement; or potentially minimally developed norms). This index describes a variable’s central tendency and dispersion along a social norm curve. If a population has agreement about a specific norm, the information can be used confidently for a range of management decisions.
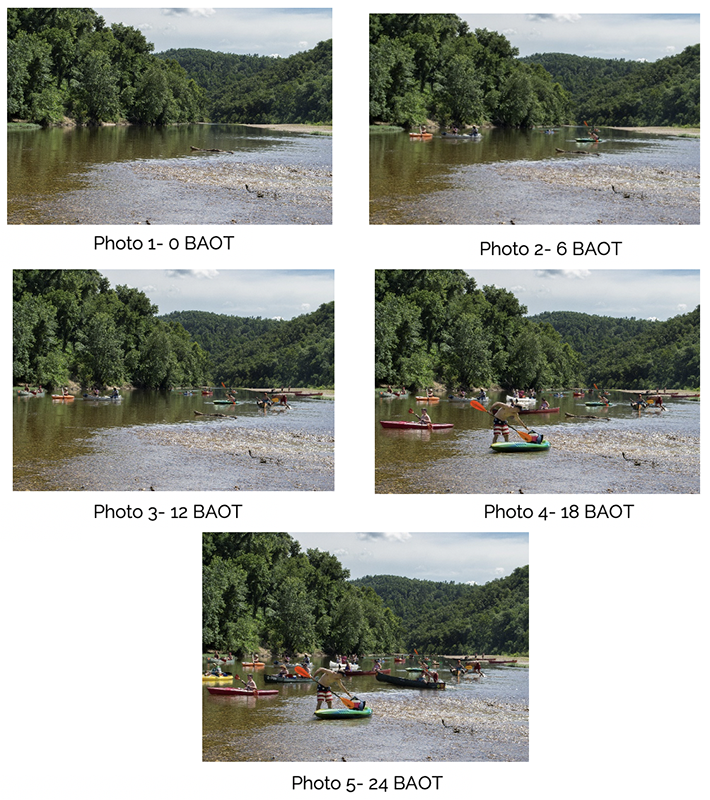
Figure 2 – Digitally edited photographs of BAOT on the study river. Edited photographs ranged from zero BAOT (solitude conditions) to 24 BAOT (saturated conditions)
Results
We intercepted 447 boaters during the study, with 190 participants surveyed in designated wilderness and 154 participants in a nonwilderness section, yielding a 77% response rate. The mean age of the participants was 40 years old, and the gender distribution of participants was relatively even with 53% of participants self-identifying as male. Most respondents reported primary residencies within three to four hours of the river, and 61% of respondents reported having at least two years of experience at the river. Chi-square and t-tests revealed that wilderness and nonwilderness users had no significant differences across income, education, age, residency zip code, or gender (p > 0.05), suggesting a demographically similar visiting population was intercepted at both survey sites.
Thresholds
For both wilderness and nonwilderness users, PCI2 values suggest relative consensus about the acceptability level for each presented condition for BAOT and encounter rates. In general, both user groups displayed decreasing levels of acceptability as BAOT and the hourly encounter rate increased. On average across groups, visitors reported a threshold, or a minimum acceptable condition, of 13 boats within view at one time and 40 encounters per hour. In other words, if visitors were to encounter more than 13 boats within view or encounter 40 or more people per hour while on the river, they would likely report unacceptable conditions. These findings also suggest that the range of acceptable conditions is 0 to 13 boats on the river and 0 to 40 encounters per hour, with the solitude condition (0 BAOT and 0 encounters) being the most acceptable for both user groups.
Differences between Groups
There were no statistically significant differences between user groups for acceptability ratings of all BAOT conditions and five of the six visitor encounter conditions (Tables 1 and 2). There was a significant difference (p = 0.05) between user groups for encounter rates of 60 people per hour, although the difference in mean scores was only 0.26 on a 9-point scale (see Table 2). Regarding conditions experienced while on the river, wilderness users reported experiencing a significantly higher BAOT (p ≤ 0.01) and a significantly higher encounter rate (p ≤ 0.01) than nonwilderness users (Table 3). There was no significant difference, however, between the user groups’ thresholds for encounters per hour (40) or BAOT (13) (see Figures 3 and 4, respectively).
On average, wilderness users reported seeing four more boats at one time than nonwilderness visitors. Wilderness visitors also reported encountering around 12 more people per hour (Table 3), suggesting that wilderness boaters experienced higher use levels than nonwilderness boaters. When researchers asked visitors “Which conditions, if any, warrant management action to improve the area,” “Which conditions are so unacceptable that you would no longer use the area,” and “Which condition is the highest level of use you believe that park managers should allow? In other words, at what point should visitor use be limited?,” there were no significant differences between user groups (Table 3). Also of note, of the 54 total respondents who indicated that “Use should never be limited” as their response, more than half (57%) were wilderness users.
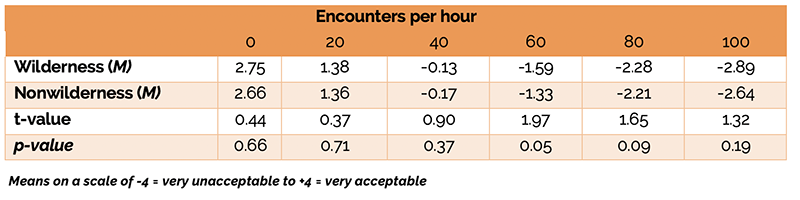
Table 1 – Summary of the mean acceptability of BAOT for wilderness and non-wilderness users
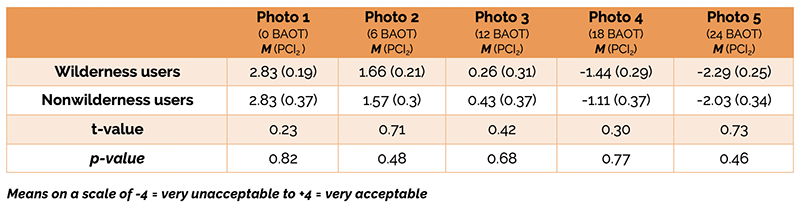
Table 2 – Summary of the mean acceptability for encounter rate per hour for wilderness and nonwilderness users

Table 3 – Summary of the evaluative dimensions for BAOT and visitor encounter rate per hour for wilderness and non-wilderness users
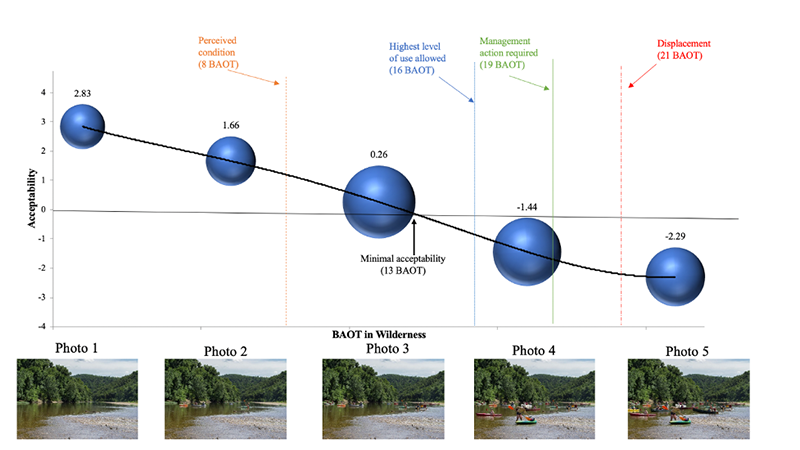
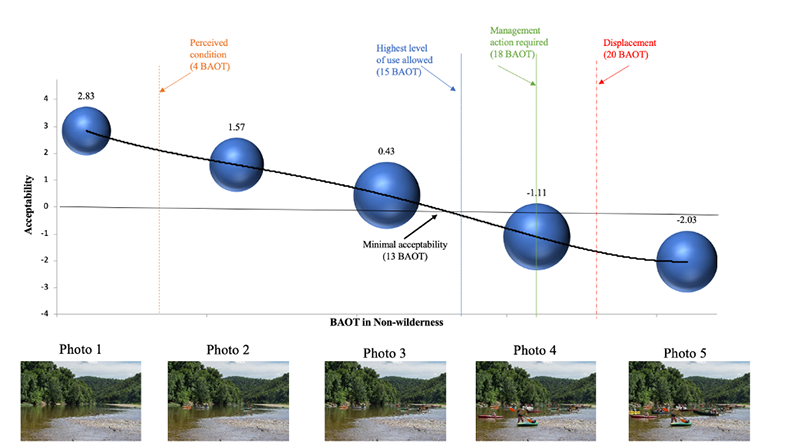 Figure 3 – PCI2 Social Norm Curves (with accompanying means) for BAOT in both Wilderness and Non-Wilderness
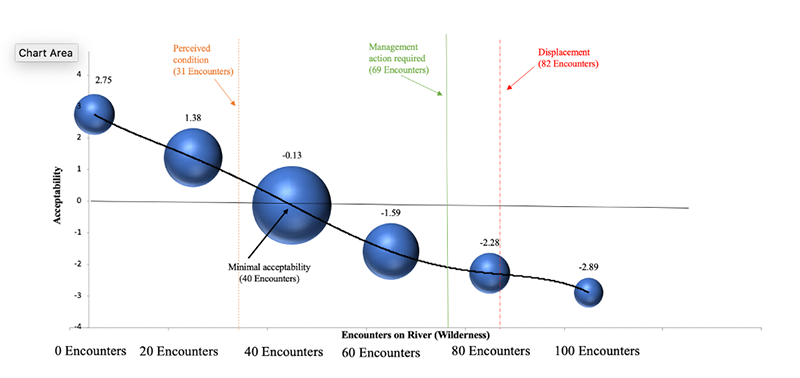
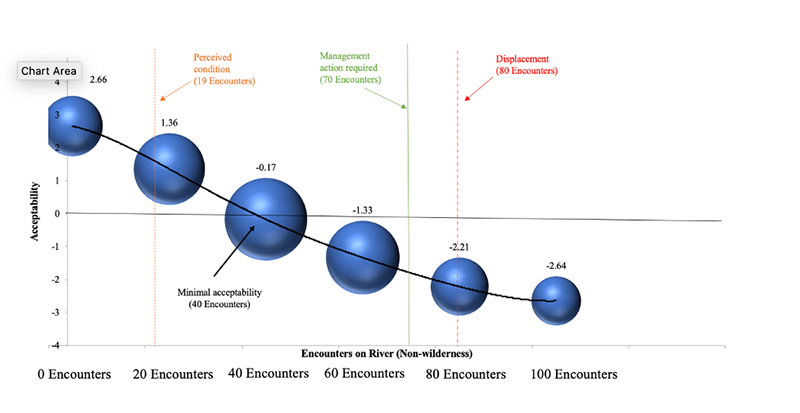
Figure 4 – Social norm curves (with accompanying means) for encounter rate per hour.
Perceived Crowding
When asked “Please rate the level of crowding you experienced today,” wilderness visitors had a larger mean score than did nonwilderness visitors (Figure 5). Ultimately, while wilderness visitors reported higher encounter rates and higher BAOT than nonwilderness users, they also reported feeling more crowded by 2.46 points on a 9-point scale (1=not crowded; 9=extremely crowded), which is statistically significant (t-value=11.43, p-value < 0.01).
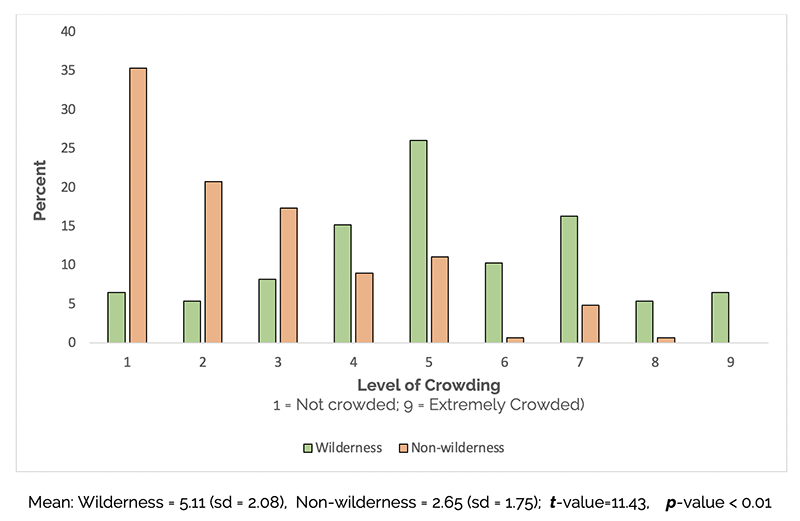
Figure 5 – Visitor responses to “Using the scale below, please rate the level of crowding you experienced at … today.”
Conclusions
This study sought to begin addressing a large question: What are the social conditions desired by the public in designated wilderness? Although we offer the results of only one focused case study, the results did not generally align with previous literature or common assumptions about wilderness visitors. Specifically, wilderness users reported experiencing significantly higher BAOT and encounter rates than did nonwilderness visitors, and wilderness visitors also expressed feeling more crowded. However, there were limited statistical differences between these two groups for acceptability ratings of BAOT and hourly encounter rates. This finding suggests that wilderness visitors did not have markedly different thresholds for use levels than nonwilderness visitors. Similarly, these two groups did not differ in their evaluation of the conditions that warrant management action, would contribute to displacement, or necessitate limiting use.
These results reflect a different narrative about wilderness users than previously developed through empirical studies using normative approaches. Consequently, four surprising conclusions pertaining to the study’s hypotheses can be made. Our first hypothesis “Wilderness users will have lower acceptability ratings for high use conditions than nonwilderness users” was not supported because no substantial differences in acceptability ratings of use conditions or associated thresholds between user groups was found. The second hypothesis, “Wilderness users will report experiencing fewer encounters than no-wilderness users” was also not supported because wilderness users did in fact, experience a higher BAOT and encounter-rate compared to nonwilderness users. The third hypothesis, “Wilderness users will report experiencing less crowding” was also not supported because wilderness users reported feeling more crowded than nonwilderness users. Our findings did, however, support the fourth hypothesis that “Experienced conditions will not influence reported norms.” In conclusion, although wilderness and nonwilderness visitors experienced different conditions during their visit, the survey results for acceptability of varying conditions for entire visiting population were largely the same with limited statistical differences between the two visitor groups.
These unsupported hypotheses raise several questions about the users of this river and similar rivers with designated wilderness and nonwilderness sections: (1) Do visitors recognize that portions of the river are wilderness and nonwilderness? (2) Do visitors understand the difference between wilderness and nonwilderness? and (3) What do the unsupported hypotheses mean for wilderness management? This study did not ask if visitors knew if they were in a federally designated wilderness area. However, the visitors’ desired conditions or demographics did not differ between user groups, which potentially means that boaters were accessing the river at points of convenience as opposed to seeking a paddle through designated wilderness. Many of the results might be quite important to managers because the legislative mandate for wilderness areas is unique and may require a reduction in use to meet certain criteria of the Wilderness Act (e.g., opportunities for solitude).
Implications
As noted, the results of this study revealed unexpected findings. However, it is difficult to determine if these results are representative of a trend that may be occurring at other protected areas and waterways. During the last decade, participation in outdoor recreation, particularly paddle sports (canoeing and kayaking) has increased (Outdoor Foundation 2018), along with an overall increase in visitation to parks and protected areas, including designated wilderness (Manning 2013). With more visitors participating in paddle sports, there is a need for a clear management strategy for these users. The legislative mandate that requires wilderness areas to provide for solitude is likely not being met in the case of this national river. When designated wilderness is a part of the recreation area in an open system consisting of many access points, it may lead to increased management challenges. One of the core missions of most protected areas is to provide opportunities for visitor experiences, but the Wilderness Act mandates for providing concurrent “outstanding opportunities for solitude” and “preservation and use in an unimpaired condition” (The Wilderness Act of 1964, US Public Law 88–577).
In conclusion, we ponder if the intended setting and associated experiences in designated wilderness are important to all wilderness users. If there are no differences in the expectations and preferences between wilderness and nonwilderness river users, and if visitor thresholds are not being violated, do visitors desire management action to maintain Wilderness Act values? The results of this study reflect that in this case, protected area managers may be managing use levels that potentially exceed the federally designated purpose of the resource (i.e., wilderness values). If this is to change, a dramatic shift in visitation and river use must be made to reinstate the values of wilderness that have potentially been jeopardized. Direct management actions, in the form of permits or limiting the number of boat rentals by local concessionaires for visitors intending to use the wilderness sections, could decrease use levels or spatially distribute use to other sections of the river. Management may also need to consider scheduled launch times to temporally distribute use to maintain the values of wilderness.
If there are no differences in the expectations and preferences between wilderness and nonwilderness river users, and if visitor thresholds are not being violated, do visitors desire management action to maintain Wilderness Act values?
This study highlights that the expectations wilderness visitors have for solitude in designated wilderness river sections may be migrating into a new channel. In an era of increasing wilderness visitation, this information can assist researchers in mapping if and how the undercurrents of wilderness values flow through today’s visitors’ expectations and correspondingly help managers in navigating these channel migrations.
About the Authors
TYLER W. CRIBBS is a doctoral student at Clemson University, Department of Parks, Recreation & Tourism Management; e-mail: tcribbs@g.clemson.edu.
RYAN L. SHARP is an associate professor at Kansas State University, Park Management and Conservation Program; e-mail: ryansharp@ksu.edu.
MATTHEW T. J. BROWNLEE is an associate professor of parks and conservation area management in the Department of Parks, Recreation & Tourism Management with a joint appointment in the Department of Forestry and Environmental Conservation; e-mail: mbrownl@clemson.edu.
ELIZABETH E. PERRY is an assistant professor at Michigan State University, Department of Community Sustainability, in the Sustainable Tourism and Protected Area Management Program; e-mail: eeperry@msu.edu.
JESSICA FEFER is an assistant professor at Kansas State University, Park Management and Conservation Program; e-mail: jfefer@ksu.edu.
References
Abbe, J., and R. Manning. 2007. Wilderness day use: Patterns, impacts, and management. International Journal of Wilderness 13(2): 21–38.
Basman, C. M., M. J. Manfredo, S. C. Barro, J. J. Vaske, and A. Watson. 1996. Norm accessibility: An exploratory study of backcountry and front country recreational norms. Leisure Sciences 18(2): 177–191.
Brownlee, M., and J. Hallo. 2013. Motivations to visit designated wilderness at Cumberland Island National Seashore. International Journal of Wilderness 19(1): 34–40.
Cole, D. N. 1996. Wilderness recreation in the United States. International Journal of Wilderness 2(3): 14–18.
Cribbs, T. W., R. L. Sharp, and M. T. J. Brownlee. 2019. Evaluating the influence of photo order on park visitors’ perceptions of crowding at Buffalo National River. Leisure Science: 1–19.
Donnelly, M. P., J. J. Vaske, D. Whittaker, and B. Shelby. 2000. Toward an understanding of norm prevalence: A comparative analysis of 20 years of research. Environmental Management 25(4): 403–414.
Fefer, J. 2019. From displaced to misplaced: Exploring the experience of visitors who were “crowded out” of their recreation destination. PhD diss., Clemson University.
Hallo, J., and R. Manning. 2010. On the Edge, Peering In. International Journal of Wilderness 16(3): 28–34.
Hallo, J. M. T., J. Brownlee, M. D. Hughes, J. Fefer, and R. Manning. 2018. The experiential carrying capacity of a barrier island: A norm-based approach at Cumberland Island National Seashore. Tourism in Marine Environments 13(2–3): 121–140.
Interagency Visitor Use Management Council. 2016. Visitor Use Management Framework: A Guide to Providing Sustainable Outdoor Recreation. Interagency Visitor Use Management Council. https://visitorusemanagement.nps.gov/content/documents/VUM_Framework_Edition%201_508%20Compliant_IVUMC.pdf
Manning, R. E. 2003. What to do about crowding and solitude in parks and wilderness? A reply to Stewart and Cole. Journal of Leisure Research 35(1): 107–118.
———. 2011. Studies in Outdoor Recreation: Search and Research for Satisfaction. Corvallis: Oregon State University Press.
Manning, R. E. 2013. Parks and Carrying Capacity: Commons without Tragedy. Washington D.C.: Island Press.
Manning, R., W. Valliere, B. Minteer, B. Wang, and C. Jacobi. 2000. Crowding in parks and outdoor recreation: A theoretical, empirical, and managerial analysis. Journal of Park & Recreation Administration 18(4): 57–72.
National Park Service Visitor Use Statistics. 2019. https://irma.nps.gov/Stats/Reports/National, accessed July 24, 2019.
Outdoor Foundation. 2018. 2018 Outdoor Participation Report. Washington, D.C.: Outdoor Foundation.
Shelby, B. 1981. Encounter norms in backcountry settings: Studies of three rivers. Journal of Leisure Research 13(2): 129–138.
Stankey, G. H. 1980. A Comparison of Carrying Capacity Perceptions among Visitors to Two Wildernesses. Ogden, UT: Intermountain Forest and Range Experiment Station, Forest Service, US Department of Agriculture.
Stankey, G. H., S. F. McCool, and G. L. Stokes. 1984. Limits of acceptable change: A new framework for managing the Bob Marshall Wilderness complex. Western Wildlands 10(3): 33–37.
US Forest Service. 2016. U.S. Forest Service National Visitor Use Monitoring Survey Results National Summary Report 2016.
US Public Law 88–577. The Wilderness Act of September 3, 1964. 78 Stat. 890.
Vaske, J. J., and L. B. Shelby. 2008. Crowding as a descriptive indicator and an evaluative standard: Results from 30 years of research. Leisure Sciences 30(2): 111–126.
Read Next

What We Have and What We Need
As we reach the end of the 26th volume of the International Journal of Wilderness, it is worthwhile to reflect on this year that was 2020.
A Tribute to Michael Soulé
The following is a tribute to the life and contributions of Michael Soulé from several colleagues and friends.
The Preservation Paradox: How to Manage Cultural Resources in Wilderness? An Example from the National Park Service
At the same time that federal agencies must comply with protection measures of the Wilderness Act, federal cultural resource laws require agencies to take into account the effects of federal undertakings on cultural resources.