Recession of Shakes Glacier in Southeast Alaska
Stewardship
April 2018 | Volume 24, Number 1
The activity of wilderness glaciers is an important indicator of both local and global environmental change. Shakes Glacier, a lake-calving glacier located 30 kilometers (18.7 miles) east of Wrangell in southeast Alaska and locally recognized for its rapid recession, has remained poorly studied due in part to difficulty of access. The glacier’s terminus is nestled in a tributary of the Stikine River, within the Stikine-LeConte Wilderness of the Tongass National Forest. This pristine wildland captured the attention of naturalists long before it had any official protection status. John Muir experienced the area on his extended travels in Alaska in 1879, before it was officially designated as wilderness. He described the Stikine River Valley as “a Yosemite 100 miles long” and numbered its glaciers at nearly 300 (Davis 2004). This included Great Glacier, Shakes Glacier, and nearby LeConte Glacier, the southernmost tidewater glacier on the Pacific Coast (Stikine-LeConte Wilderness n.d.).
The crowning jewel of the Stikine-LeConte Wilderness is the unique Stikine River, the fastest, free-flowing navigable river in North America (Stikine-LeConte Wilderness n.d.). The Stikine River flows more than 500 kilometers (311 miles) from its headwaters in the Cassiar Mountains of Canada before traversing the Alaska-Canada border. The Alaskan Stikine continues 64 kilometers (40 miles) to the river’s delta, where dunes of silty glacial till shift daily, inhibiting efforts to chart the channels and making it highly difficult to navigate.
In the 1970s, plans were in place to dam the Stikine River and wrangle the surrounding wildland with infrastructure development. However, in 1980 the designation of the area as the Stikine-Leconte Wilderness by Congress via the Alaska National Interest Lands Conservation Act (US Public Law 96-487) halted all industrial speculation. The high level of conservation protection provided by this act allows the Stikine River to flow freely. What is lost in unharnessed hydroelectric power is certainly gained in visitor experiences, moments of pristine harmony with nature, and the richness of the wild salmon, trout, and eulachon. The spring and summer runs of these small marine vertebrates attract predators such as seals, sea lions, and bears, as well as the second highest concentration of bald eagles in North America (Stikine River Delta 2016). The official wilderness designation also enables student groups and professional researchers to conduct reliable long-term studies in the diverse environment, leading to a better understanding of the ecosystem and, in many cases, ecosystem responses to climate change.
Recent efforts to monitor Shakes Glacier have been driven by both historical and contemporary local observations. Longstanding Wrangell residents who visit the glacier recreationally, as tour captains and guides, or to collect calved glacier ice for subsistence purposes have observed unusually fast, potentially accelerating recession during the last 50 years. In recent history, Wrangell Island locals have worked in conjunction with the Wrangell Ranger District of the Tongass National Forest to fill a deficit in recorded data for Shakes Glacier while enriching the education of Wrangell’s youth. This has been achieved through the Shakes Glacier Survey Team (SGST), established in 2011 by a quartet of Wrangell’s dedicated professionals: jet boat captain and owner of Breakaway Adventures Eric Yancey, Wrangell Public School District teacher Jen Miller, and expert surveyors Gregory Scheff and Michael Howell of R&M Engineering.
In 1698 (±5 years), Shakes Glacier extended to the end of Shakes Slough, a tributary of the Stikine River, and converged with the main channel (Viens 1995). The glacier currently terminates in Shakes Lake, a glacial lake above Shakes Slough, 14.6 kilometers (9.1 miles) from its 1698 position. It has been suggested that the width of the glacial lake at the glacier’s terminus and correspondingly the surface area of the glacier terminus in contact with liquid water may positively affect the rate of glacial recession, owing to the high energy conductivity, and therefore melting power, of fresh water (Davidson 2014). Long-term changes in temperature may also affect glacial recession over a period of lag time. Lag time can be defined as the time it takes for a glacier to respond to a significant change in climate with 60% conformity, either by retreating or advancing (Pelto and Hedlund 2001).
The objective of this study was to determine the pattern of terminal recession for Shakes Glacier over the past 50 years, and to identify variables that affect the rate of terminus recession. More extensive ablation data collection (e.g., flow speed and total volumetric ice loss) and a better understanding of environmental variables are necessary to interpret recent activity of Shakes Glacier. Interpretation of glacial activity may provide scientists and managers with information to predict future changes in Shakes Glacier and its potential impact on the Stikine-LeConte Wilderness.
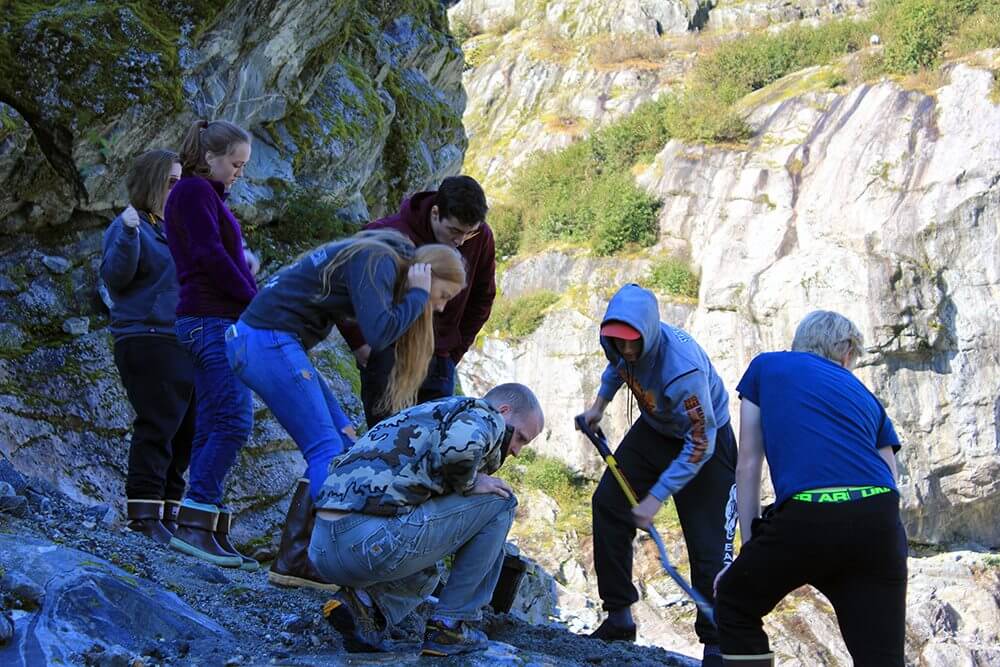
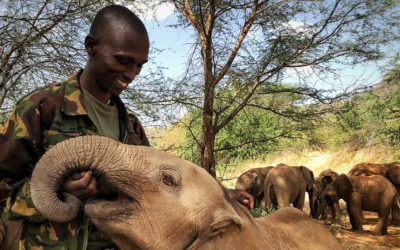
Figure 1 – Students from the 2017 Shakes Glacier Survey Team uncovering glacial till from a control point marker, a mark permitted in a special use permit by the Wrangell Ranger District.
Methods
Shakes Glacier Survey Team
Applications for student members of Shakes Glacier Survey Team are open to all Wrangell High School students. A new team is selected each year from the pool of applicants by Wrangell Public School District (WPSD) advisors Heather Howe and Jenn Miller, and has ranged from three to seven members. Most members enter without prior surveying experience and receive their first instruction with professional grade survey equipment from annual team training. Within a week of training, the team of students, WPSD advisors, jet boat captain and founder Eric Yancey, and on-site R&M Engineering contractor Mike Howell were transported to the glacier to collect data on the terminus position.
Terminus Position Data Collection by Shakes Glacier Survey Team
Trimble Global Navigation Satellite Systems (GNSS) were placed at two predesignated control points, serving to increase accuracy using triangulation between the rover unit, survey units, and satellites. The Trimble GNSS rover unit was then used to plot a track line via jet boat, maneuvered as close to the glacier face as safely possible. R&M Engineering later adjusted this track line to the actual terminus position using satellite imagery data and Earth models. A special land-use permit administered by the Wrangell Ranger District of the Tongass National Forest authorizes the physical monumentation of control point locations into bedrock within the dedicated wilderness. This process of recording the glacier’s terminus location was conducted by the SGST team in 2011, 2013, 2014, and 2015.
Supplementary Terminus Position Data
Collected data were supplemented with remotely sensed glacier terminus data obtained from Google Earth Engine and EarthExplorer, and aerial photographs from the U.S. Navy and US Forest Service. Pre-1948 terminus location data were obtained from Viens (1995) who used dendrochronology, radiocarbon dating, and moraine location to infer historic terminus position for years 1698, 1780, and 1909.
Terminus Position and Lake Width Data Analysis
All satellite images, aerial photographs and historical terminus positions from Viens (1995) were imported into ArcGIS 10.3. The aerial photographs and Viens’ data were georeferenced using the ArcGIS georeference tool (compilation of this data shown in Figure 2). Utilizing the ArcGIS measure tool, metric distance was found for lake width at each recorded terminus position and for the distance between recorded termini. The recession rate between termini was calculated, and the data separated into two, time periods based on the projected accuracy and frequency of data points: 1698-1948 and 1948-2016. The 1698-1948 is considered less accurate than the remotely sensed record of the period 1948-2016. Annual recession rate was then analyzed with lake width at the terminus for each time using Excel 15.24.
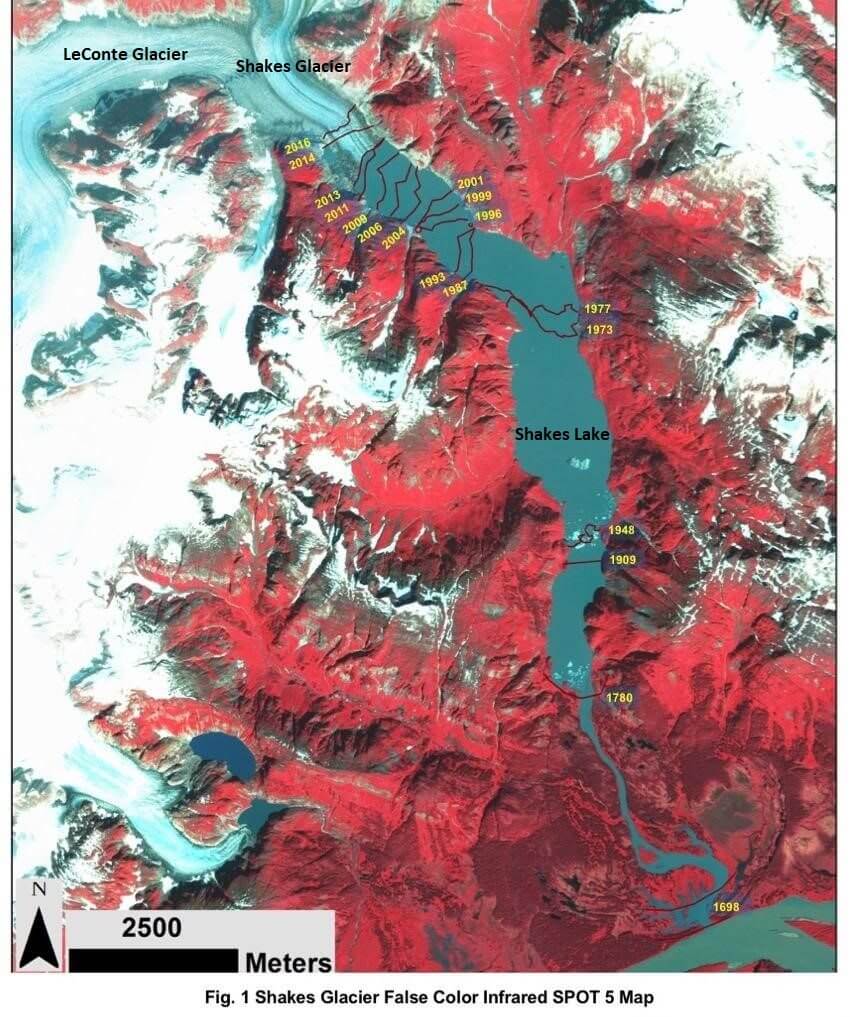
Figure 2 – Shakes Glacier historical terminus positions showing 18 of 21 terminus lines on 2013 False Color Infrared SPOT 5 Map (3 years omitted to reduce clutter).
Temperature Data Collection and Analysis
To further understand causal factors of Shakes Glacier recession, annual temperature was tested as an explanatory variable in the terminus recession rate. Average annual temperature data was gathered from NOAA when accessible (1919–2011) and supplemented with data from Weather Underground (2012–2016) for the Wrangell Airport Weather Station (~30 km [18.7 miles] southwest from Shakes Glacier), then analyzed using Excel. To smooth variation between individual years, mean decadal temperature was obtained. Decadal averages were adjusted for potential glacier lag times of 15–60 years, as ascertained for maritime glaciers located in temperate climates by Davies et al. (2014). Lag time adjustments were made by shifting the temperature data forward in 6 different 10-year increments before conducting a comparison with terminus recession rate. Inadequate data prior to 1948 for both terminus position and temperature precluded an accurate analysis for that period.
Using scatterplots, linear trend lines were fitted to determine the data’s coefficient of determination (R2). In addition, multiple linear regressions were conducted for the following variables:
x= (year, lake width 1698-2016) y= (annual terminal recession rate)
x= (year, lake width 1948-2016) y= (annual terminal recession rate)
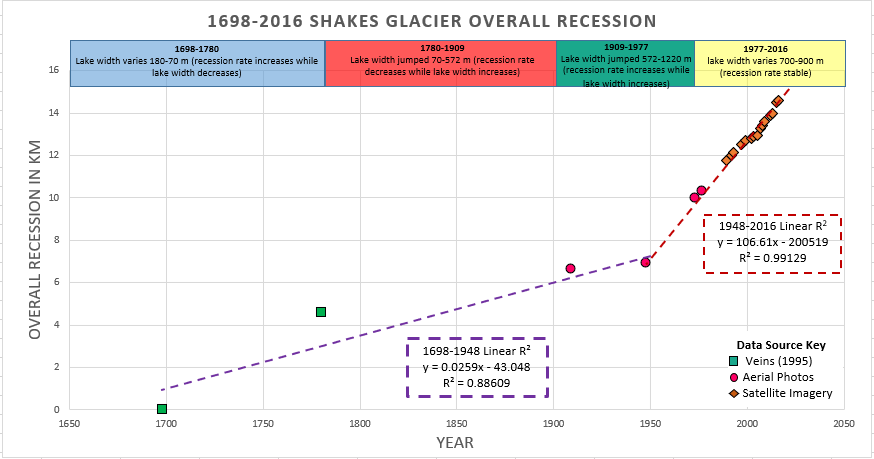
Figure 3 – Overall terminus recession graph with two linear trend lines separated by a substantial change in terminus recession rate in 1948. Colored time regions reflect substantial changes in the width of the glacial lake at the terminus.
Results
Overall Glacier Recession
Between 1698 and 1948, the mean annual terminus recession rate of Shakes Glacier was 26 meters (85 ft.) per year(m/yr). Overall recession was apparent and substantial, but due to the few data points, not statistically significant for this period. From 1948 to 2016, the mean annual recession rate was 107 m/yr (351 ft./yr) (Figure 3). This recession rate was statistically significant, with 99% of the variation in overall recession attributed to year, demonstrating that Shakes Glacier has been receding at a remarkably steady rate.
Variables Driving Recession Rate
For the period 1698–2016, there was a positive and statistically significant relationship between year and average annual recession, with 25% of the variation in recession rate attributed to year. The relationship between average decadal temperature, adjusted for 10-, 20-, 30-, 40-, 50-, and 60-year lag times, and average recession rate was examined for the period 1948–2016. This analysis did not suggest statistically significant correlations between decadal temperatures adjusted for various lag times and the contemporary recession rate of Shakes Glacier.
The analysis of lake width as an explanatory variable for terminal recession rate is represented by colored bars in Figure 2 and can be summarized by the following time periods:
- 1698–1780, terminus recession rate increased from the baseline rate of 0 m/yr and lake width decreased a net of ~110 m (351 ft.).
- 1780–1909, terminus recession rate decreased from the 1698–1780 rate, and lake width increased a net of ~500 m (1,640 ft.).
- 1909–1977, terminus recession rate increased from the 1780–1909 rate, and lake width increased a net of ~380 m (1,247 ft.).
- 1977–2016, terminus recession rate was stable and contiguous with that at the end of the prior period and lake width varied (<250m [820 ft.]).
The relationship between the variation of lake width and terminal recession rate were inverse (1698–1780 and 1780–1909), direct (1909–1977), and inconclusive (1977–2016), indicating that a consistent relationship does not exist. The relationship between lake width at the terminus and average recession rate for the entire period 1698–2016 demonstrated a significant positive correlation. However, when this regression was conducted using only the remotely sensed data from the period 1948–2016, results did not suggest a correlation between lake width at the terminus and the average rate of terminus recession, likely due to the remarkably stable recession rate despite changes in lake width (<700m [2,296.6 ft.]) for this period. Further analyses are necessary to determine the relationship between lake width and terminal recession rate.
Trend lines from single variable analysis indicated that a linear relationship was most supported by the data. As a result, multiple linear regressions were chosen to conduct analysis of the dual variable relationships between lake width, year, and average recession rate for periods 1698-2016 and 1948-2016. The models were not significantly improved when both variables were considered as explanatory for the annual terminal recession rate of Shakes Glacier.
“In addition to an increased understanding and data on the trends of the Shakes Glacier, the Shakes Glacier Survey Team’s monitoring project is an exemplary model of citizen science.”
In addition to an increased understanding and data on the trends of the Shakes Glacier, the Shakes Glacier Survey Team’s monitoring project is an exemplary model of citizen science. Inspired by the glacier’s rapid retreat, Wrangell locals and high school students united their skill sets to form a capable survey team and obtained a permit for their proposed survey from the Wrangell Ranger District of the Tongass National Forest.
A symbiotic relationship between SGST and the Wrangell Ranger District ensures long-term continuity of the Shakes Glacier survey and enhances student and public education. Each year the project has grown to attain a higher level of scientific professionalism and reach a broader audience. Wrangell Ranger District maintains a permanent student-made display describing the project, the Tongass National Forest’s webpage on Shakes Glacier now incorporates SGST’s data, and in April 2017, the team gave their first presentation to the Wrangell community at the US Forest Service–organized Chautauqua speaker series event. In 2016–2017, SGST’s data was made readily available to the community of Wrangell and local ecotourism companies, and SGST’s captain presented the team’s data and the results of this study to the professional science community for the first time at the Northwest Scientific Association’s conference. The Wrangell Ranger District provided aerial photos and information regarding historic data used in this study and reviewed drafts of this article and the poster presented at the Northwest Scientific Association’s conference.
In coming years, the Shakes Glacier Survey Team could expand their survey to measure additional variables such as lake depth and exposed terminus height to broaden interpretive capabilities. Because of this study, the student team now has an expansive and easily accessible historical database, and the knowledge and resources available to expand upon data mapping and statistical data analyses.
The educational enrichment of Wrangell High School students is a foundational goal of the SGST, and while adult members provided support and direction in logistics and data collection, the leadership of SGST’s additional activities is largely student based. In this way, students initiated progress in the direction of their interest, and developed skills and knowledge valuable for a career in any field, although perhaps most importantly as future leaders in the global discussion of the human relationship with climate variability. Partnerships with local businesses, access to the Stikine-LeConte Wilderness, and passionate teachers and students have also enabled Shakes Glacier Survey Team to increase awareness of glacial recession and its role in envisaging the impact of climate change on wilderness character.
It is vital that conservation managers, legislators, and other decision makers remain alert to the results of these partnerships and studies, including those produced by citizen science. A comprehensive understanding and collaboration are the first steps to the continued conservation of our wilderness.
Discussion
The data points from 1948 to 2016 provide a comprehensive record of terminus recession. The small number of data points (3) during the period of 1698–1909 (and the possible effect of increased accumulation during the Little Ice Age 1300–1850 [Fagan 2001] on recession rate calculations) limited the ability of statistical analyses to identify relationships when considering the entire period.
Regarding the effect of average decadal temperature and lake width at the terminus on the recession of Shakes Glacier, it is possible that the relationships are obscured by other variables, such as the bathymetry (underwater topography) of Shakes Lake, glacial bed slope, and actual glacial lag time. The effect of these variables may also be apparent in ice volume loss rather than terminus retreat. It would be necessary to evaluate these additional variables directly; however, many of them have yet to be measured for Shakes Glacier.
Lag time of Shakes Glacier may also have influenced the results of this study. If the lag time is 50 years or more, the full effects of anthropogenic climate change, which was first prominent in temperature models in the late 1970s, have yet to occur. Volumetric discharge and terminus recession could increase soon. Even if the rate of terminus recession remains stable at 107 meters (351 ft.) per year, Shakes Glacier will recede to a point of separation between its dual sources, dividing into two glaciers and possibly retracting from the lake, in approximately 15 years (2032). This could limit access to the glacier by locals who rely on glacier ice to keep their subsistence salmon catch fresh, as well as inhibit tourism related to the glacier, a major source of income for many Wrangell residents.
REYN HUTTEN is an undergraduate at Dartmouth College in Hanover, New Hampshire. She was a member of the Wrangell High School Shakes Glacier Survey Team 2014-17; email: reynhutten@gmail.com
Acknowledgments & References
Acknowledgments
A big thank you to Dave Rak, Jackie de Montigny, Andi Slusser, Victoria Houser, and Dustin Wittwer of the US Forest Service; to Bruce McCune and Joseph Liddle for statistics help; and to my parents for their invaluable guidance. I am very grateful to Jenn Miller and Eric Yancey for their creation of and dedication to Shakes Glacier Survey Team, to R&M Engineering for guiding the team in data collection, and to the student survey team for their participation and enthusiasm.
References
Imagery and aerial photos from https://explorer.earthengine.google.com, https://earthexplorer.usgs.gov/, and the United States Forest Service. Temperature data from https://www.wunderground.com/history/airport/PAWG/ and https://www.ncdc.noaa.gov/cdo-web/sear.
Davidson, R. H. 2014. Evaluating Glacier Movement Fluctuations Using Remote Sensing: a Case Study of the Baird, Patterson, LeConte, and Shakes Glaciers in Central Southeastern Alaska. University of Southern California.
Davies, B. J., N. R. Golledge, N. F. Glasser, J. L. Carrivick, S. R. Ligtenberg, N. E. Barrand, M. R. Van Den Broeke, M. J. Hambrey, and J. L. Smellie. 2014. Modelled glacier response to centennial temperature and precipitation trends on the Antarctic Peninsula. Nature Climate Change 4: 993-998. Davis, W. 2004. Deep North. Retrieved from http://ngm.nationalgeographic.com/ngm/0403/feature5/fulltext.html
Fagan, B. 2001. The Little Ice Age: how climate made history 1300-1850. New York: Basic books.
Pelto, M.S., and C. Hedlund. 2001. Terminus behavior and response time of North Cascade glaciers, Washington, USA. Journal of Glaciology 47(158): 497-506.
Stikine River Delta. 2016. Retrieved from http://www.audubon.org/important-bird-areas/stikine-river-delta
Stikine-LeConte Wilderness – General Information. (n.d.). Retrieved from http://www.wilderness.net/NWPS/wildView?WID=579
U.S. Public Law 96-487. Alaska National Interest Lands Conservation Act of 1980. 94 Stat. 2371.
Viens, R. J. 1995. Late Holocene climate change and calving glacier fluctuations along the southwestern margin of the Stikine Icefield, Alaska. University of Washington. (Doctoral dissertation).
Read Next
Leave No Trace: How It Came to Be
Despite being unable to identify the precise origin of Leave No Trace, we can identify by whom, when, and how the Leave No Trace message came to be made consistent and coherent and the dissemination of Leave No Trace messages came to be institutionalized.
CoalitionWILD
A generation of new ambition is staring at their future and are grappling with what to do next and where to start.

Book Review
The arguments over whether, why, and when governments should preserve public lands from private ownership have a very long history.