Science & Research
June 2017 | Volume 23, Number 1
by JOHN J. DAIGLE, WALTER OPUSZYNSKI, and MATT LAROCHE
The Allagash Wilderness Waterway (AWW) is a 92-mile-long (148 km) ribbon of lakes, ponds, rivers, and streams located in northern Maine. Starting with a chain of lakes controlled by dams, the river drops northward in the heart of Maine’s vast commercial forests. A canoe trip to complete the length of the watercourse typically takes eight days and features 9 miles (14.5 km) of Class II–III whitewater and a portage around the 40-foot (12.2 m) Allagash Falls. The state of Maine enacted legislation in 1966 establishing the AWW, and in 1970 it was the first state-administered area to be included in the National Wild and Scenic Rivers System designated as “wild” by the secretary of the interior at the request of the governor. Harris et al. (2012) note that some characteristics make the waterway unique while others create management tensions. For example, the Federal Register in which the AWW was accepted by the secretary of interior as a wild river reflects some of the AWW’s controversy since it was accepted as a wild river despite having three dams with impoundments (US Public Law 90-542; Allagash Wilderness Waterway 1970; National Park Service [NPS] and US Forest Service [USFS] 1982). Also, there are developments within the AWW not typical of “wild” designated rivers, such as multiple access points by gravel roads and amenities at campsites including picnic tables and ridgepoles (NPS and USFS 1982).
The management of the AWW is conducted by the Maine Department of Agriculture, Conservation, and Forestry, Bureau of Parks. In 1999, a management plan was approved for the AWW that established a concept defining “wilderness character” for the Restricted Zone and the watercourse, drawing from the federal wilderness definition (Wilderness Act 1964), with emphasis on preserving natural character and solitude but also recognizing the challenges of other statutory provisions of the AWW. For example, the AWW statute allows uses that are not usually found in wilderness areas of the National Wilderness Preservation System: large motors are allowed on boats on Telos and Chamberlain Lakes; motors of up to 10 horsepower are allowed on canoes elsewhere, except Allagash Lake and stream; floatplanes are allowed to land and take off from designated areas; timber harvesting is allowed within 1 mile (1.6 km) of the bounds of the watercourse outside of the Restricted Zone; and snowmobiling is allowed on designated trails and areas.
Providing quality recreational experiences while preserving the natural character of the AWW poses some significant management challenges. Primary among these is the unique combination of natural setting and accessibility, and nearness to major population centers in the United States and Canada. The AWW is within a day’s drive of 32 million people and is known regionally as an excellent canoe trip with summer water and relatively easy, enjoyable white water. Although visitation had declined at the AWW from the peak visitation periods of the 1970s and 1980s, a national assessment of demand and supply trends (Cordell et al. 1999) and the Maine State Comprehensive Outdoor Recreation Plan have predicted increases in the visitor demand for remote recreation opportunities.
Campsite Assessments in 1999
The expected increase in visitation to the AWW and the desire of management to establish a monitoring system led to an extensive three-summer inventory of campsites and their condition starting in 1999 (Daigle, Speirs, and Wallace 2002). Given the desire to preserve natural conditions at campsites, 12 different measurements were made to assess the level of natural conditions – for example, damaged trees, loss of ground cover at campsites, amount of vegetative screening between campsites, and campsite area.
Visitor Survey 2003
A survey of AWW visitors was implemented in 2003 to better understand who visits the watercourse, including their activities, method of travel on the waterway, length of stay, types of groups, previous experience, place of residence, why they visit, experiences and level of satisfaction, and assessment of travel and camping conditions encountered. The survey helped to identify the importance of certain campsite attributes, including preferences for resource and social conditions encountered at campsites and while traveling on the AWW (Daigle 2005). Some of the highlights of the visitor study that helped guide the campsite assessments were as follows:
- In spite of high visitor approval ratings of their overall trip experience, nearly one-half of visitors rejected the first available campsite because of its condition (e.g., lack of vegetation ground cover, erosion) or location (e.g., proximity to another occupied campsite, the area having a cluster of campsites).
- AWW visitors rated the importance of campsite attributes, and those attributes receiving the highest proportion of “very important” or important” ratings included amount of litter present at campsite (96%), level ground for tent at campsite (94%), dry ground at campsite (94%), ability to locate an available campsite when ready to stop (86%), being out of sight or sound or other campers (84%), and the amount of vegetation screening between campsites (80%).
- Those campsite attributes or conditions receiving the highest proportion of “slightly important” or “not at all important” ratings by visitors included number of trees with exposed roots at campsite (71%), and number of trails/paths at campsites other than trails to privy and water access (66%).
Matching the experiences visitors seek with opportunity settings best suited to providing those experiences is one of the major challenges to the outdoor recreation manager (Clark and Stankey 1979). For example, litter and other signs of visitor use impacts appear to be more important to recreation users as compared to management-related impacts such as signs and presence of rangers.
Campsite Assessments in 2014
The state of Maine approved a new management plan for the AWW in 2012. An identified goal of the plan was the implementation of a new inventory of campsites and their condition. Based on needs identified by management, replication of some measurements from the first study in 1999–2001 were repeated in 2014: (1) campsite area, (2) core area barren of vegetation, (3) vegetative screening between campsites, and (4) vegetative screening between campsite and water. New measurements that focused on soil erosion at water access points were added, even though it was not included in the first study.
Methods
In this article, we report findings from both assessment studies to examine change on campsites in the AWW. We focus on aspects of change that have comparable data between the two studies: the total number of campsites, campsite overall size, campsite core area barren of vegetation at campsites, and changes in vegetative screening between campsites. More detailed information on the campsite assessments and other campsite condition measurements are available in Daigle, Speirs, and Wallace (2002) and Opuszynski, Kacir, and Shumway (2015).
Visitors to the AWW are directed to stay at designated campsite areas that have signs viewable from the water, and more than half of the campsite areas have multiple physical campsites. In the management plans for the watercourse these designated camping areas are labeled as campsites, and many campsites are multi-cell (2–5 cells or campsites).
A multi-cell campsite (sometimes called a campsite cluster or camping area) is actually multiple campsites that have their own picnic table, ridgepole, fire pit, and tent site, and share a bathroom facility and are located near a starting point or popular access points along the watercourse and near portages.
In the first study, all campsites at a camping area were inventoried from a center point with a GPS receiver, and the data collected in the field were entered into MapInfo mapping software to create campsite maps. A metal pin was buried several inches below the ground at the center point of the campsite. Numerous photographs with azimuth readings were taken of the camping area, and campsites were recorded with directions to features such as the center point in relation to signature features such as nearby large rocks or trees. All of this information was utilized as a reference to locate the campsites in the second study. Readers should be aware that several metal pins were not relocated, so other information was used to reestablish center points and conduct subsequent measurements. Similar to the first study, a center point was located with a GPS receiver, and the data collected in the field was later entered into QGIS software to create campsite maps. Digital photographs were taken to help verify campsite locations as well as to portray visual changes in campsite condition between study periods. In both studies, no attempt was made to investigate if any other visitor- created campsites existed along the shores of the waterway.
To assess changes in the condition of campsites, data were compared that measured in each study period the campsite core area (the central portion of the campsite that was largely devoid of vegetation) and campsite area (the outer boundary of the campsite). The campsite core is the highly impacted area where vegetation and organic litter cover had been eliminated, exposing mineral soil and/or rock. The campsite core area usually included the heavily used area near the fire pit and picnic table. In a few instances, campsites were clustered so close to each other that it was difficult lt to determine where the edge of one campsite boundary ended and the other began, so the evaluators used their best judgment to decide on the campsite boundaries.
In the first study, radius measurements were made from the center point in the campsite core to the perimeter of the core area and edge of the campsite every 22.5 degrees, making for 16 radius measurements. In the second study there was limited time for data collection, so radius measurements from the center point were reduced to every 45 degrees with 8 radius measurements. By changing these techniques in measurement, the potential error rate of calculating the core and campsite areas were increased. The 16 transect method has a percent error rate of about 8%, while the 8 transect method has a percent error rate of about 22% (Marion 1991).
During both campsite condition assessments, the vegetation screening between campsites were rated with three impact categories labeled (1) vegetation sufficient so that no other campsites are visible, (3) campsites are somewhat visible with partial vegetative screening, or (5) campsites are visible to each other with no vegetative screening. Photos taken in the first study to make the assessments were used in the second study as a reference for consistency in rating of vegetation between campsites.
Results of the two campsite inventory studies were compared to estimate general AWW-wide trends in campsite conditions and to further assess the effectiveness of some management strategies that had been implemented in some locations. In the first study, the cell area was measured in m2 and in the second study measured in ft2, so data were converted into one comparable measurement unit. The campsite area was converted into a condition class assessment with 1=up to 100 m2; 2=101–200 m2; 3=201–300 m2; 4=301–400 m2; and 5=over 401 m2. We report the number of sites on which that parameter increased, decreased, or stayed the same over the 15-year study period.
Results
A total of 77 camping areas and 146 campsites were inventoried during the first assessment period of 1999 through 2001, and a slight reduction was observed in 2014, with a total of 76 camping areas and 131 campsites. The change in the number of campsites was due in part to management actions that reduced multiple campsites in a camping area to fewer campsites to improve the user experience by increasing the vegetative screening between campsite cells. Additionally, other campsites were modified by management to accommodate more tent sites, and a few had been relocated or repaired where campsites had previously been located in wet areas (Figure 1).
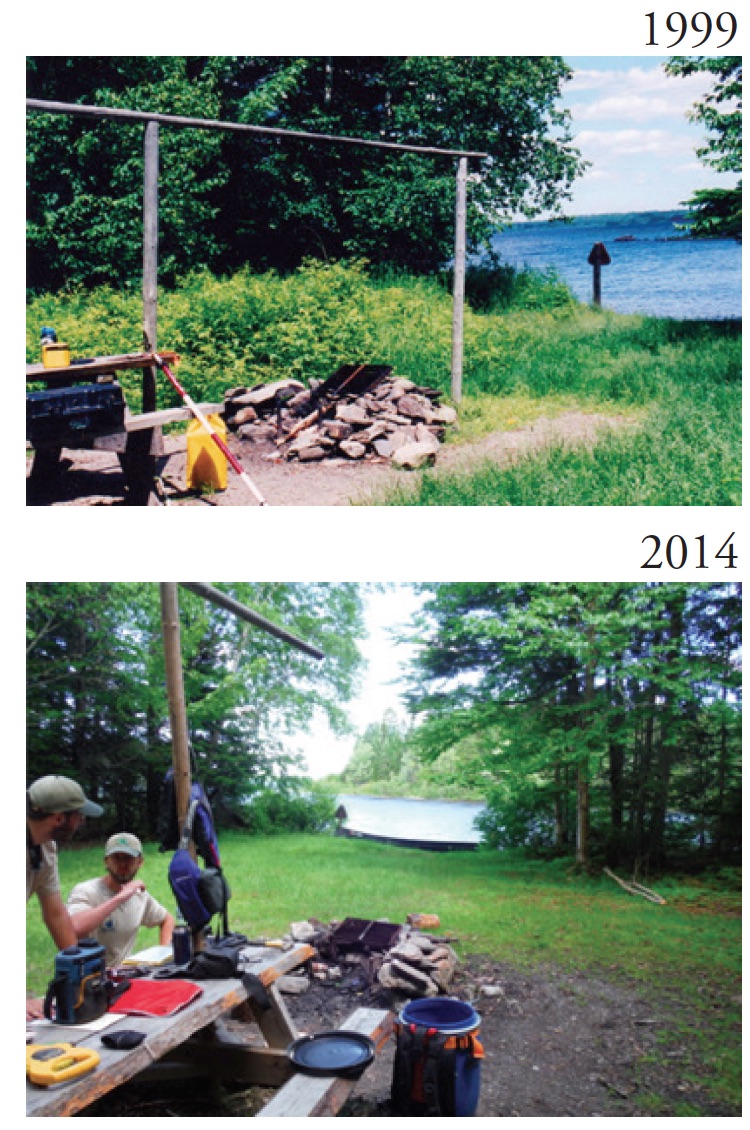
Figure 1 – Camping cell area increased in some instances as a result of management relocating the fire pit and picnic table farther away from water.
Overall, the footprint of total impact (campsite area) changed very little from 1999 (146 campsites=27,618 m2) to 2014 (131 campsites=25,226 m2). Therefore, we focus the subsequent reporting on the comparable 131 campsites in both study periods. The median campsite area decreased slightly (8 m2) between 1999 and 2014. A slightly higher number of campsites were reduced in size (68 campsites) as compared to those that increased in size due to visitor use or management actions (63 campsites) (Table 1). Although stability was the norm during the 15-year period, dramatic differences were observed in the impacted area for some campsites, and those that experienced more dramatic change (five campsites actually doubled in size) tended to be located at high-use areas.
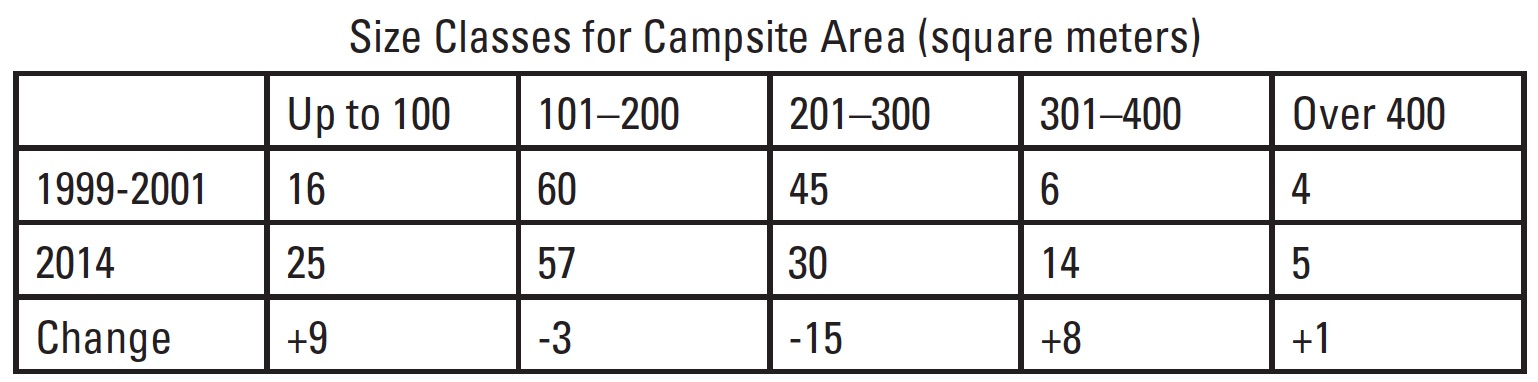
Table 1 – Distribution of campsites by size class
Even though the overall total footprint of all campsite areas was relatively constant over the 15-year period, there were some shifts between the size of individual campsites (Table 1). There were more campsites in 2014 that were class 1 or up to 100 m2 compared to the 1999 study. Conversely, several campsites have become very large, with an increase in the number of campsites within class 4 or class 5. Several of the campsite areas with multiple cells reportedly shifted to a larger class size, and this may need management attention for several reasons. First, campsites at this size may compromise the visitor experience or appear impacted too much by visitor use. Second the enlargement of the campsite area may reduce the amount of vegetative screening and jeopardize seclusion from other campers in a nearby campsite. Another visitor survey of use and user characteristics along with measures of experience preferences would assist managers and direct needed attention to some impacted campsite areas of the AWW.
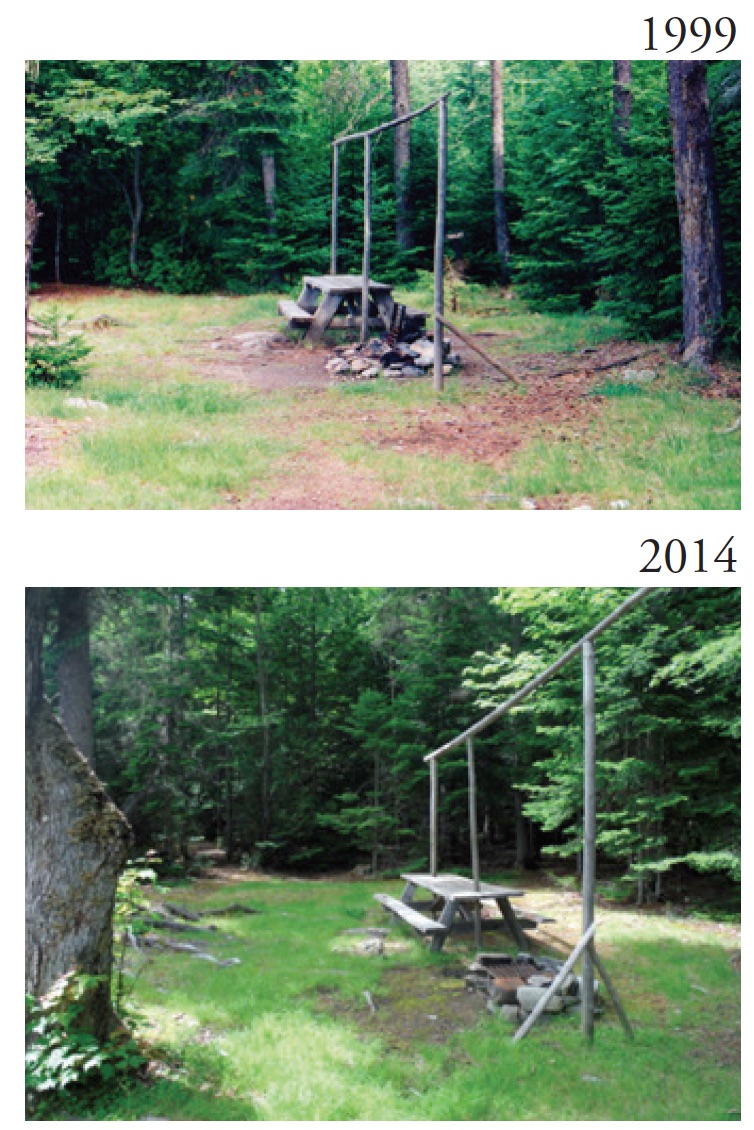
Figure 2 – Many of the observed changes during the 15-year period were a decrease in the amount of vegetation cover loss at camping cells.
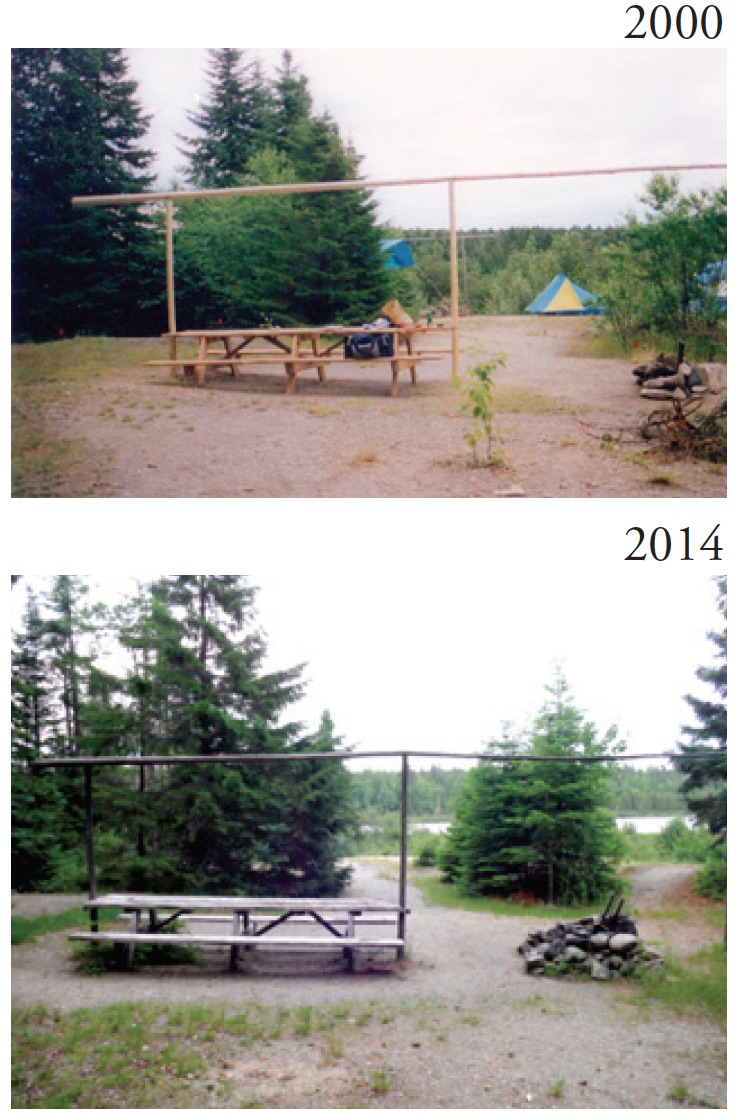
Figure 3 – A few camping cells rated for vegetation screening changed from class 3 “partial vegetation screening” to class 1 “total vegetation screening” as a result of management reducing the number of cells at a multi-cell campsite during the 15-year period.
During the 15-year period of the study, average conditions of the core areas that were barren of vegetation improved slightly on the 131 campsites. The median core area of barren vegetation was the same for both assessment periods; however, 69 campsites had gained more ground-cover vegetation as compared to those that experienced more loss of vegetation ground cover (61 campsites). Only one campsite was unchanged in terms of core area of barren vegetation. The increases observed at campsites in relation to vegetation cover tended to be grass species that are resilient and resistant to visitor use (Figure 2). The total number of visitor camping nights decreased between assessment periods, and this may have given opportunity for vegetation to recover at some campsites (Harris et al. 2012). Of the 61 campsites that experienced an increase in core area of barren vegetation, 7 campsites experienced a doubling of core area of barren vegetation compared to the first assessment period. These campsites were located in areas with high visitor use and dark shaded overstory conditions.

Figure 4 – More than 90% of visitors reported seeing moose on their trip in the 2003 visitor survey
A total of 25 campsites, with multiple campsites in a camping area, experienced enough vegetative change over the 15-year period to be reclassified in terms of vegetative screening or visibility between multi-cell campsites: 22 campsites had increased vegetation screening as compared to 3 campsites with decreased screening (Figure 3). The majority (61) of the campsites remained unchanged in vegetation screening. Overall, the positive changes were probably the result of management efforts to protect and enhance vegetation screening at camping areas with multiple campsites.
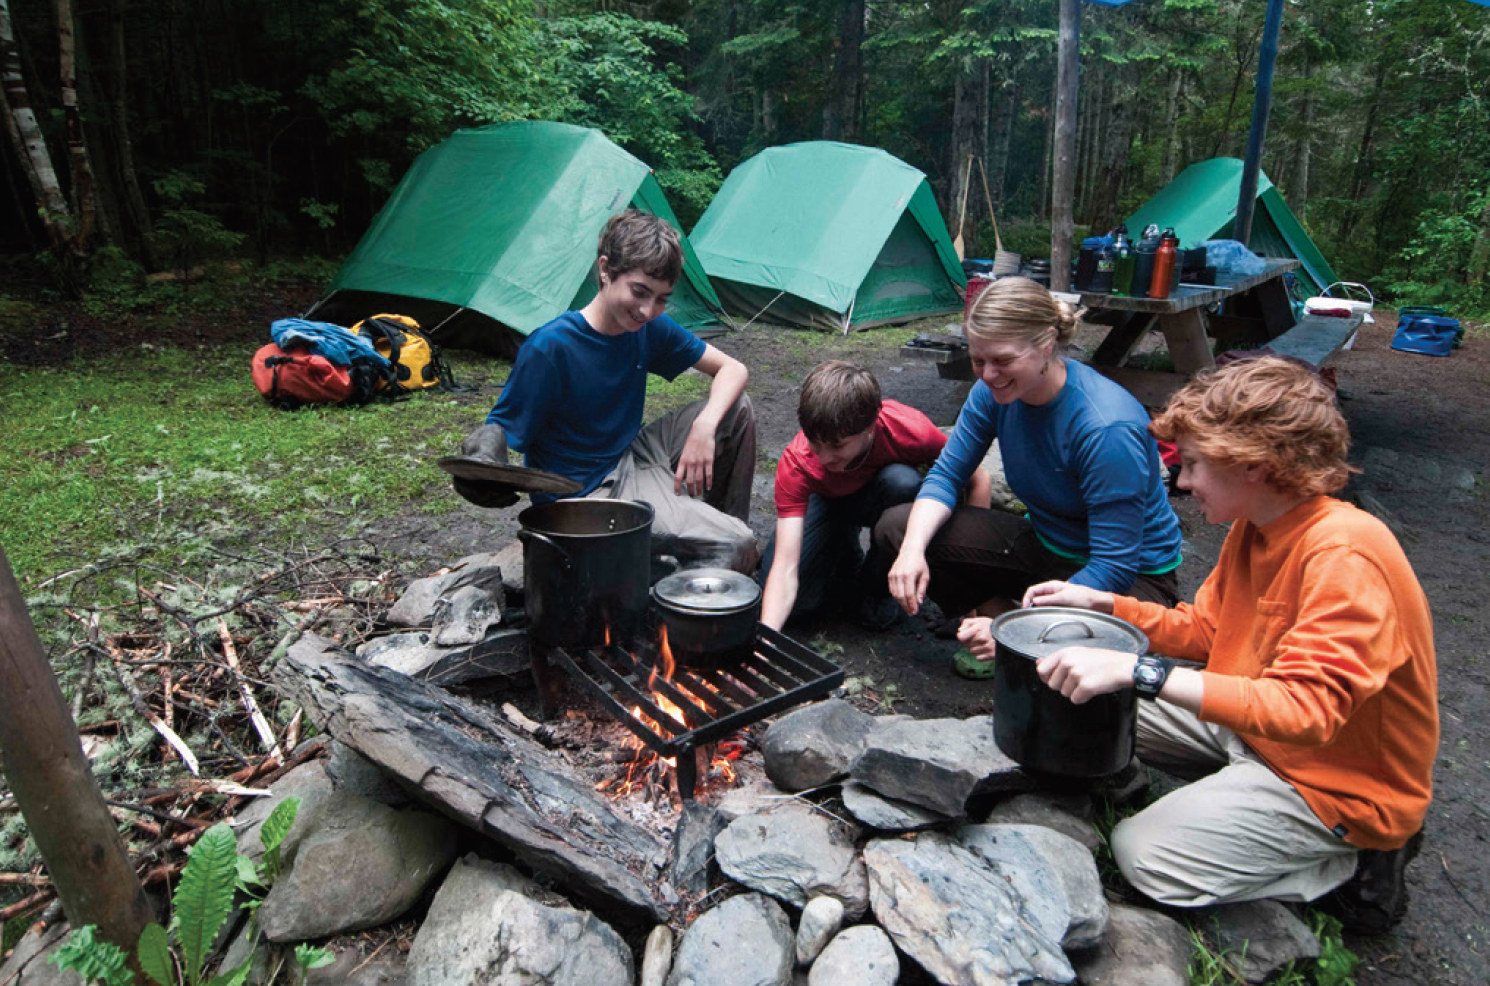
Figure 5 – Visitors enjoying the Allagash Wilderness Waterway.
Conclusions and Discussion
A comprehensive inventory of all campsites beginning in 1999 made it possible to detect the development of new campsites and to evaluate meaningful and comparable changes in the physical condition of existing sites over time. The impact parameters measured at campsites were guided by management objectives in the 1999 and 2012 Allagash Wilderness Waterway Management Plans. One overarching objective was the wilderness character concept as defined by the AWW Management Plan related to campsites: opportunities are provided along the watercourse for primitive, secluded, and remote travel and camping. The visitor survey in 2003 provided information to help assess use and experiences and to guide management strategies such as the vegetative screening at camping areas with multiple campsites (Figure 4). The visitor survey helped to inform the revised 2012 AWW plan and identify impact parameters to reassess, such as the amount of vegetation between campsite cells and amount of vegetation between campsites and water.
We recommend that campsite condition assessments be supplemented with visitor surveys to help inform management decisions. Where there are documented improvements to campsite conditions, feedback from visitors is needed to assess how management actions are influencing the visitor experience and finding suitable campsites. For example, will a higher percentage of AWW visitors now find more campsites suitable as compared to past visitor surveys that reported a relatively high percentage found them not suitable because of campsite conditions or not having enough vegetative screening at the site (Figure 5)?
Monitoring the condition of recreation resources is a perennial challenge for wilderness and protected area managers, so efforts that may improve efficiency and accuracy are important considerations (Monz and D’Luhosch 2010). In addition to the technical aspects of determining indicators and accurate measurement protocols, managers often face significant limitations on the financial and personnel resources required to carry out field collection and subsequent data analysis (Leung and Monz 2006). Decisions were made in the second campsite condition assessment to improve efficiency of data measurements so that more time was permitted for needed measurements on erosion at water access points. On one hand, the efficiency measures taken (decrease the number of directions measurements were taken) likely increased the measurement error and degree of accuracy; however, the change in protocol created an opportunity for collecting other data to assist future management decisions.
Other campsite monitoring techniques have been utilized that may improve efficiency and accuracy such as digital image analysis (Monz and D’Luhosch 2010) and variable transect method (Marion 1991). Continued research on measurement techniques that may increase efficiency and accuracy is critically important when choices need to be made on continued monitoring of certain campsite attributes and not others (Cole 1983; Cole et al. 1997). For example, the inventory in the first campsite condition assessment collected tree damage and root exposure that may have helped to explain changes in condition of campsites. Finding the optimal mix of campsite attributes to measure and acceptable degree of accuracy is a continued need for managers, and future research may help managers make more informed decisions related to monitoring programs of recreation resources.
A major challenge to management of places with at-large or dispersed camping is avoiding the creation of entirely new campsites. Additional data on changes in the condition of campsites must be complemented with data on change in the number of campsites to fully assess trends in overall campsite impact (Cole et al. 2008). In some instances, where places have both designated camping and dispersed at-large camping, a management problem may occur with new campsites being added by visitors (Cole et al. 2008). The AWW management strategy involving designated camping agrees with others such as Thornburgh (1986) and Marion and Farrell (2002) in that this strategy can be highly effective in minimizing campsite impact and especially avoiding impacts associated with new campsites.
Acknowledgments
The authors thank the Maine Department of Agriculture, Conservation, and Forestry, Bureau of Parks and Lands and the Maine Agricultural and Forest Experiment Station at the University of Maine for providing support for this research. We thank employees of the AWW and students Robert Kacir from Paul Smiths College and Brendan Shumway, Jennifer Speirs, and Benjamin Wallace from the University of Maine for their help and support during the data collection. Finally, we thank the helpful suggestions provided by Chad Dawson and other reviewers of this article.
JOHN J. DAIGLE is the leader of the Parks, Recreation, and Tourism program and professor in forest recreation management at the University of Maine; email: jdaigle@maine.edu.
WALTER OPUSZYNSKI is the trail director of the Northern Forest Canoe Trail, Waitsfield, Vermont; email: walter@ northernforestcanoetrail.org.
MATT LAROCHE is the superintendent of the Allagash Wilderness Waterway; email: Matt.LaRoche@maine.gov.
VIEW MORE CONTENT FROM THIS ISSUE
References
Allagash Wilderness Waterway. 1970. Appendix F: Federal Register Text Allagash Wilderness Waterway. Federal Register. 70-9231.
Clark, R. N., and G. H. Stankey. 1979. The Recreation Opportunity Spectrum: A Framework for Planning, Management, and Research. General Technical Report PNW-98. Portland, OR: USDA Forest Service, Pacific Northwest Forest and Range Experiment Station.
Cole, D. N. 1983. Monitoring the Conditions of Wilderness Campsites. USDA Forest Service Research Paper INT-303. Intermountain Forest and Range Experiment Station.
Cole, D. N., A. E. Watson, T. E. Hall, and D. 1997. Spildie. 1997. High-Use Destination Area in Wilderness: Social and Biophysical Impacts, Visitor Responses, and Management Options. USDA Forest Service Research Paper INT-483. Intermountain Research Station.
Cole, D. N., P. Foti, and M. Brown. 2008. Twenty years of change on campsites in the backcountry of Grand Canyon National Park. Environmental Management 41: 959–970.
Cordell, H. K., C. J. Betz, J. M. Bowker, et al., eds. 1999. Outdoor Recreation in American Life: A National Assessment of Demand and Supply Trends. Champaign: IL: Sagamore Publishing.
Daigle, J. 2005. Allagash Wilderness Waterway Visitor Survey 2003. Maine Agricultural and Forest Experiment Station. Misc. Report 436. University of Maine.
Daigle, J. J., J. C. Speirs, and B. M. Wallace. 2002. Monitoring the Condition of Campsites in the Allagash Wilderness Waterway – Summers 1999–2001. Technical Report submitted to the Maine Department of Conservation and Bureau of Parks and Lands, Augusta, ME.
Harris, W., T. Morrison, M. LaRoche, and Turner. 2012. Allagash Wilderness Waterway Management Plan. December 2012. Maine Department of Agriculture, Conservation, and Forestry. Division of Parks and Public Lands. Augusta, ME.
Leung, L. F., and C. A. Monz. 2006. Visitor impact monitoring: What, why, and how? George Wright Forum 23(2): 7–10.Maine Department of Conservation. 1999. Allagash Wilderness Waterway Plan. January. Division of Parks and Public Lands. Augusta, ME.
Marion, J. L. 1991. Developing a Natural Resource Inventory and Monitoring Program for Visitor Impacts on Recreational Sites: A Procedural Manual. Natural Resources Report PS/NRVT/NRR-91/06S. Denver, CO: US Department of Interior National Park Service. National Resources Publication Office.
Marion, J. L., and T. Farrell. 2002. Management practices that concentrate visitor activities: Camping impact management at Isle Royale National Park, USA. Journal of Environmental Management 66: 201–212.
Monz, C. A., and P. D’Luhosch. 2010. Monitoring campsite conditions with digital image analysis. International Journal of Wilderness 16(1): 26–31.
National Park Service, US Forest Service. 1982. Wild and Scenic Rivers Guidelines; National Wild and Scenic Rivers System; Final Revised Guidelines for Eligibility, Classification and Management of River Areas. Federal Register 47(173): 39, 454–39, 461.
Opuszynski, W., R. Kacir, and B. Shumway. 2015. Allagash Wilderness Waterway User Impact Study – 2014. Technical Report submitted to the Maine Department of Agriculture, Forestry, Conservation, and Forestry and Division of Parks and Lands. Augusta, ME.
Thornburgh, D. A. 1986. Responses of vegetation to different wilderness management systems. In Proceedings – National Wilderness Research Conference: Current Research, comp. R. C. Lucas (pp. 108–113). USDA Forest Service General Technical Report INT-212. Intermountain Research Station.
US Public Law 90-542. Wild and Scenic Rivers Act of October 2, 1968. 82 Stat. 906.