Moose in the mountains, Mount Evans Wilderness Photo credit © Beth McCarley.
Biodiversity within the National Wilderness Preservation System: How Well Do Wilderness Areas Represent Species Richness across the Contiguous United States?
Science & Research
December 2020 | Volume 26, Number 3
PEER REVIEWED
ABSTRACT
We quantified the spatial representation of amphibians, birds, mammals, and reptiles across the contiguous US (CONUS) by evaluating biodiversity, measured by species richness, within wilderness areas compared to CONUS. On average, amphibians and reptiles are underrepresented, although representation of biodiversity varied geographically for all taxa. The southwestern and southeastern United States are regions with the greatest concern and opportunity to increase biodiversity representation, maintain corridors between wilderness areas, and protect biodiversity hotspots. Protection of biodiversity in these regions can be strengthened through increased protection of federal lands and/or conservation partnerships between public and private landowners.
Faced with the pressures of an increasing human population, including urban development, agricultural expansion, and resource utilization, much of the United States has lost or is losing the ecological processes inherent in natural ecosystems (Jones et al. 2018, 2015; Newbold et al. 2016). However, ecological processes are preserved within the natural ecosystems of wilderness areas because many anthropogenic stressors such as road building, logging, mining, energy development, agriculture, mechanical and motorized use, development of tourism facilities, and permanent structures are restricted (Dietz et al. 2015; US Public Law 88–577, 1964). Furthermore, the International Union for Conservation of Nature (IUCN) classifies wilderness areas as category 1b, which “protect the long-term ecological integrity of natural areas that are undisturbed by significant human activity, free of modern infrastructure, and where natural forces and processes predominate, so that current and future generations have the opportunities to experience such areas” (Dietz et al. 2015; Dudley 2008).
The protection of natural ecosystems also serves to protect species biodiversity, which in turn is critical for ecosystem health and function (Cardinale et al. 2012). However, the purpose of the Wilderness Act of 1964 is far-reaching and provides many valuable services aside from ecological conservation. The act established the National Wilderness Preservation System (NWPS) to designate wilderness areas that preserve sites of geological, scientific, educational, scenic, or historical value as well as ecological value and natural condition (US Public Law 88–577 1964). Thus, biodiversity benefits from wilderness protection, but there are many other reasons for wilderness designation. Policy, politics, and the opportunity to protect ecological as well as nonecological treasures result in unequal protection and representation of ecosystems and biodiversity (Bleich 2016; Dawson and Hendee 2009; Sarkar 1999). For instance, studies have shown that wilderness areas and protected areas are often at high elevations and in areas with unproductive soil, which does not represent the full range of species biodiversity within a landscape (Aycrigg et al. 2013; Scott et al. 2001).
In 1964, only US Forest Service lands were designated as wilderness areas; however, the act directed review of all roadless areas under the jurisdiction of the secretary of agricultural and interior within 10 years, leading to new criteria for wilderness designation including the representation of as many natural ecosystems as possible (Dawson and Hendee 2009). The aim of representation is to save some of everything to reduce the risk of species decline and extinction (Shaffer and Stein 2000). Despite the goal of ecosystem representation, Aycrigg et al. (2013) demonstrated that representation within protected areas was insufficient for portions of the United States. Additionally, the representation of natural ecosystems is often used as a surrogate for species biodiversity representation, which remains a key question in wilderness research.
Other studies have sought to quantify species biodiversity representation within wilderness areas. Using ecological systems (i.e., habitat types) as a surrogate measure of species biodiversity, Dietz et al. (2015) demonstrated that during 1964–2014 the total area of the NWPS increased, but the diversity of ecological systems accumulated (436 ecological systems) peaked in 1984. Additionally, 21% of ecological systems were unrepresented in wilderness areas (Dietz et al. 2015). Similar patterns were observed by Aycrigg et al. (2016) for ecological systems within wilderness areas and by Aycrigg et al. (2013) within the entire US protected areas network. Using species richness (i.e., number of species by taxa in a given area) as a measure of biodiversity, Jenkins et al. (2015) found a mismatch between the location of protected areas in the contiguous US (CONUS), which are mostly in the western United States and high levels of species richness, which are in the southeastern United States. However, the representation of biodiversity in wilderness areas compared to CONUS was not evaluated.
We sought to quantify the representation of species biodiversity in wilderness areas using species richness as our measure of biodiversity. Both total species richness and endemic species richness for amphibians, birds, mammals, and reptiles were acquired from Jenkins et al. (2015). Endemic species were defined as species that have their entire range within CONUS. Our objectives were to:
- Quantify average total and endemic species richness by taxa within wilderness areas and across CONUS.
- Compare the frequency distribution of species richness in wilderness areas and across CONUS to see how different levels of species richness are represented in wilderness.
- Observe how spatial distribution of species richness and wilderness areas differ.
Using the results from these objectives we present areas of concern and opportunities where future efforts for protection and preservation of biodiversity could be most worthwhile.
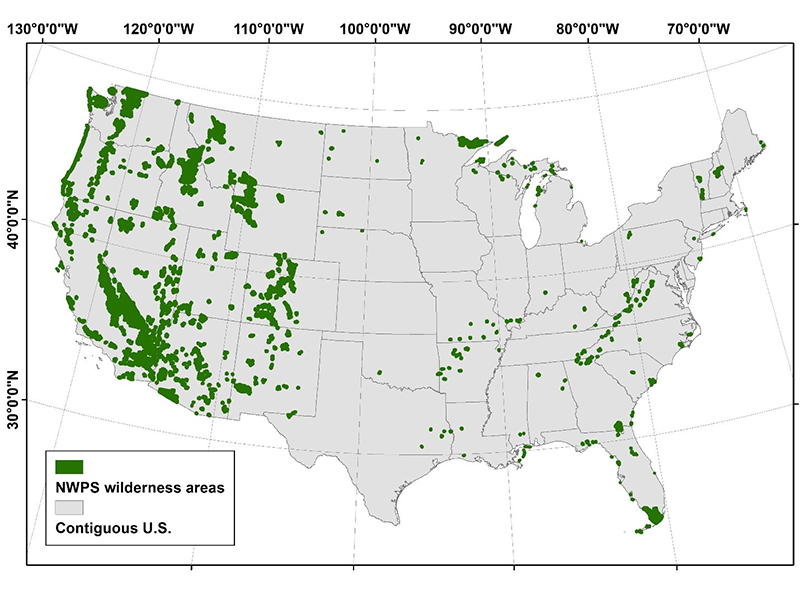
Figure 1 – Spatial distribution of current wilderness areas within the National Wilderness Preservation System. (NWPS) of the contiguous U.S. (CONUS). Wilderness boundaries obtained from Wilderness Connect (Available: http://www.wilderness.net).
Methods
Data
We obtained wilderness boundaries within CONUS from Wilderness Connect (www.wilderness.net). There was a total of 714 federally designated wilderness areas included in this analysis (Figure 1). We used species richness (i.e., the number of species in a given area) grouped by taxa (amphibians, birds, mammals, and reptiles) from Jenkins et al. (2015) as our measure of biodiversity. Species richness was determined by overlaying species range maps and counting the number of unique species in each taxon for a 6.2-mile (10 km) resolution grid across CONUS. This process resulted in raster maps where each pixel had an integer value describing the number of unique species for a given taxa in that pixel. Bird data were acquired from BirdLife International, NatureServe for reptiles, and IUCN for amphibians and mammals. Extinct and nonnative species were excluded for all taxa. For birds, both breeding and nonbreeding ranges within CONUS were included. Jenkins et al. (2015) calculated species richness in this way for all species (i.e., total) and for endemic species, which have their entire range within CONUS. Total species richness included 270 amphibians, 591 birds, 359 mammals, and 295 reptiles. Endemic species richness included 188 amphibians, 15 birds, 102 mammals, and 89 reptiles.
Analysis
For our assessment of biodiversity representation, we overlaid species richness maps by taxa onto the wilderness boundaries and extracted species richness values within wilderness areas. For our first two objectives, we used two measures to describe biodiversity: mean species richness and the frequency distribution of species richness. Mean species richness provides a single metric to evaluate if biodiversity across CONUS is represented in wilderness areas. If the mean species richness for wilderness areas was lower than for CONUS, then biodiversity was underrepresented in wilderness areas, whereas if the mean species richness for wilderness areas was equal to or higher than CONUS, then biodiversity was adequately represented.
The frequency distribution of species richness describes the area covered by each level of species richness. Due to spatial patterns of biodiversity, some levels of species richness are more common in CONUS. For instance, extremely high species richness (i.e., high biodiversity) is generally less frequent than low or moderate levels. Comparing the frequency distribution of species richness indicates how representative wilderness areas are across all levels. Equal frequency distributions indicated that biodiversity in wilderness areas was fully representative of biodiversity in CONUS, while unequal distributions of species richness indicated at what levels biodiversity in wilderness areas was under- or overrepresented. We calculated the density of the frequency curve for each level of species richness and used the difference between wilderness areas and CONUS to show representation at each level. We conducted these analyses for all species and endemic species by taxa. To address our third objective, we visually compared mapped species richness and wilderness areas to assess the pattern of biodiversity compared to the pattern of wilderness areas.
Results
The comparison of total mean species richness indicated that amphibians and reptiles were underrepresented in wilderness areas, while birds and mammals were adequately represented (Table 1). Similar results were observed for endemic species richness, with amphibians and reptiles again being underrepresented compared to birds and mammals (Table 1).
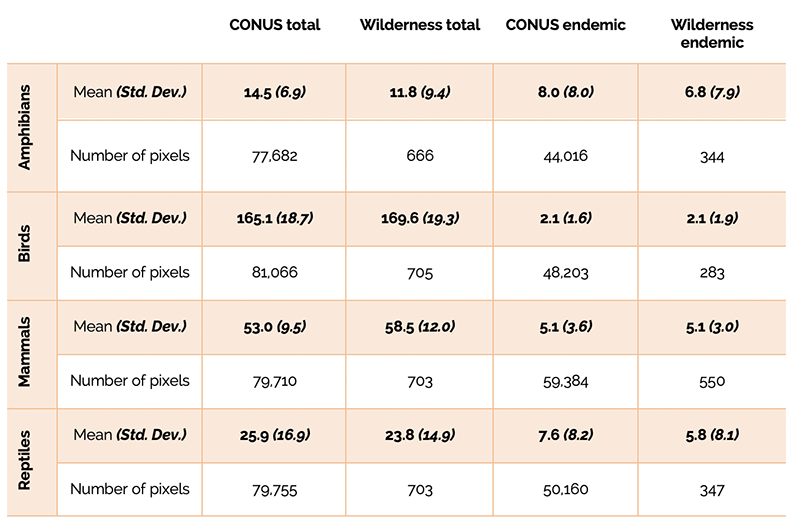
Table 1 – Mean and standard deviation for total and endemic species richness in the contiguous US (CONUS) and in wilderness areas by taxa
Comparing frequency distributions of total species richness for all taxa showed differences between CONUS and wilderness areas, suggesting underrepresentation of certain levels of species richness (Figure 2). For example, amphibians tended to be represented at lower levels of species richness (fewer than 10 species), but mostly underrepresented at more than 10 species. Birds were better represented at levels above 171 species. Lower species richness values (fewer than 53 species) for total mammal species within CONUS were not represented within wilderness areas even though average species richness was higher in wilderness (Figure 2). On the other end, high values of species richness (greater than 40 species) for total reptile species were largely underrepresented in wilderness areas, even though some levels (mostly between 1 and 4 and 28 and 39 species) were represented.
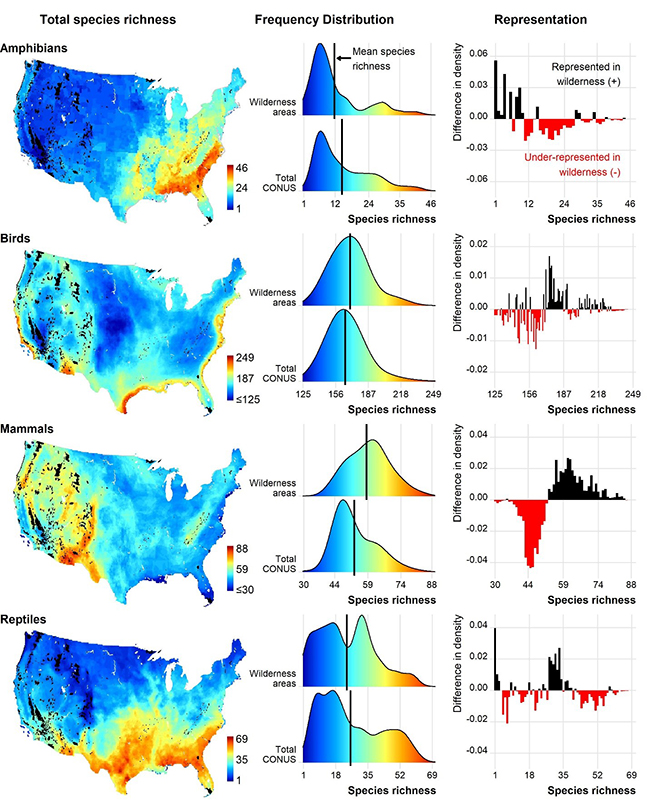
Figure 2 –Total species richness mapped across the contiguous US (CONUS), frequency distribution of species richness within wilderness areas and within CONUS, and representation of species richness in wilderness areas calculated as the difference in density values of the frequency distributions.
Different trends were observed in comparing frequency distributions of endemic species (Figure 3). Amphibians were generally underrepresented at most levels of species richness, with most wilderness areas representing only one species. Much like total species richness, birds were underrepresented more at lower levels (between 2 and 5 species). Mammals were only underrepresented at low (1–2 species) and high (more than 10 species) levels of species richness. The difference in frequency distribution of reptiles exhibited the opposite trend, with the lowest (1–2 species) and highest (more than 27 species) levels being represented in wilderness areas.
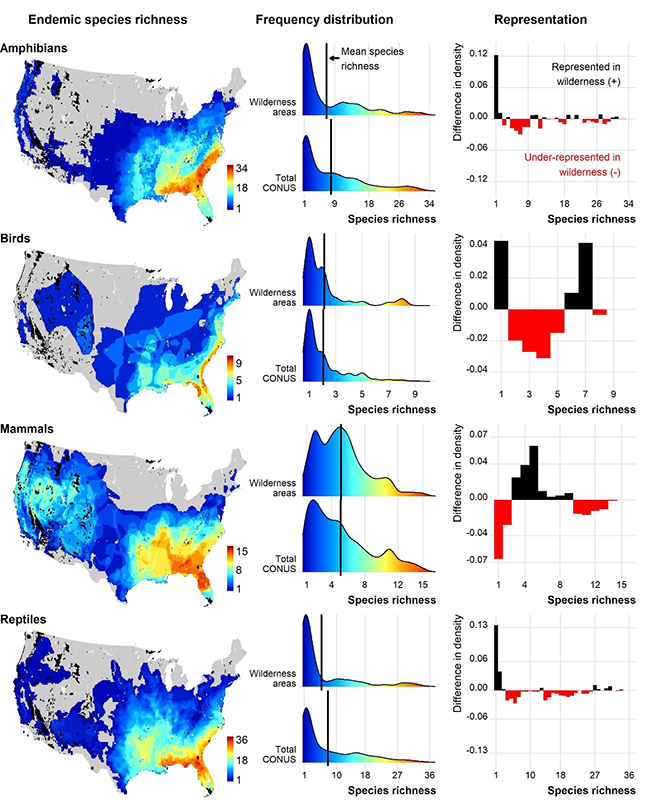
Figure 3 –Endemic species richness mapped across the contiguous US (CONUS), frequency distribution of species richness within wilderness areas and within CONUS, and representation of species richness in wilderness areas calculated as the difference in density values of the frequency distributions
Total species richness varied across CONUS for each taxon and highlights areas of concern and opportunity for species conservation. Amphibian species richness was highest in the southeast, bird species richness was highest along the coasts, mammal species richness was highest in mountainous areas, and reptile species richness was highest across the southern United States (Figure 2). For all taxon, endemic species richness was highest in the southeastern United States (Figure 3).
The spatial trends appear to be tied closely with our results of the frequency distribution analysis. For instance, endemic mammals were well-represented between 3 and 9 species, which corresponds spatially to wilderness areas in the intermountain west, Appalachian Mountains, and Ozark plateau (Figure 3). Likewise, total mammal species richness occurs at lower levels of species richness throughout much of United States where there are fewer wilderness areas (Figure 2). These observations highlight the importance of geography in translating underrepresentation of biodiversity into actionable opportunities to gain representation by targeting specific regions for conservation.
Discussion
Biodiversity Representation in Wilderness Areas
We found differences in the mean species richness and frequency distribution of species richness between wilderness areas and CONUS, which appears to be driven by the mismatch between distribution of wilderness areas and underlying environmental heterogeneity across CONUS influencing species ranges, including topography, climate, and land cover. Most amphibian and many reptile species occur in southeastern United States, hence, fewer amphibians and reptile species are represented in wilderness areas because most wilderness areas occur in the western United States (Figures 1 and 2). Likewise, most endemic species for all taxa occur in the Southeast and are therefore underrepresented in wilderness areas (Figure 3). The spatial pattern of biodiversity and wilderness areas across CONUS also explains why some levels of species richness are underrepresented for birds and mammals (Figures 2 and 3).
There are multiple approaches for assessing and comparing biodiversity between areas, such as hotspots, indicator species, and dissimilarity indices (Van Dyke 2008). Each approach measures biodiversity differently, and the conservation goal needs to be considered when choosing the appropriate biodiversity measure. For instance, Rodrigues et al. (2004) found that globally, conservation areas did not match biodiversity and that any attempt to include more biodiversity would need to account for biodiversity patterns, such as endemism, rather than a percentage-based approach, such as species richness. This is a valid concern, which we observed comparing the results of our analysis of representation and the visual assessment of species distributions with wilderness areas. For example, average endemic species richness for birds was 2.1 species for both wilderness areas and across CONUS, suggesting adequate representation by this measure. However, the spatial pattern of endemic birds and wilderness areas presents a different conclusion. Along the Texas gulf coast, which is an area of high bird diversity, there are no wilderness areas. Therefore, it might be true that overall endemic bird biodiversity is represented in wilderness areas, but certain species may rely on other types of protected areas or be lacking any significant protection at all. Representation of biodiversity is meant to be only a starting point with which to assess the overall state of biodiversity protection in wilderness areas. Wilderness managers and policy makers will likely find additional opportunities for targeted protection, which is equally worthwhile.
“Representation of biodiversity is meant to be only a starting point with which to assess the overall state of biodiversity protection in wilderness areas. Wilderness managers and policy makers will likely find additional opportunities for targeted protection, which is equally worthwhile.”
Another factor influencing our results is the difference in species ranges. Numerous factors influence species ranges, but large mammals (e.g., grizzly bears [Ursus arctos]) need large ranges in which to survive (Diniz-Filho et al. 2005; Gaston 1996; Jenkins et al. 2015). Graham and Stenhouse (2014) demonstrated that young adult male grizzly bears in western Canada had an average range of 501 mi2 (1,298 km2), while female bears with cubs had an average range of 82 mi2 (213 km2). In CONUS, only 4% of wilderness areas are larger than the range of a young adult male grizzly bear, and 26% are larger than the range of a female grizzly bear with cubs. Wilderness is an important part of their range because it provides areas where conflict with humans is minimized (Bjornlie et al. 2014; Landry et al. 2001; Mattson 1997). The difference in size between wilderness areas and a species’ range suggests that many large mammal and bird species are likely to intersect wilderness areas, but that adequate representation of biodiversity may not translate to successful conservation as wilderness may only capture a portion of their range. This is particularly true for bird species, which rely on portions of their range for different purposes such as breeding. Further analysis would be useful to determine if wilderness areas proportionately represents all life cycle ranges for birds (La Sorte et al. 2015).
Using the definition of an endemic species provided by Jenkins et al. (2015) in which a species has its entire range within CONUS, the large discrepancy between total bird species richness and endemic bird species richness can be explained Many bird species spend part of their life cycle outside CONUS and would not be considered endemic. The sky island region of southern Arizona and New Mexico has high values of species richness for birds, mammals, and reptiles (Figure 2), but low values of endemic species richness (Figure 3). This could be an artifact of defining endemics as only within CONUS because the range of many local species may extend into Mexico.
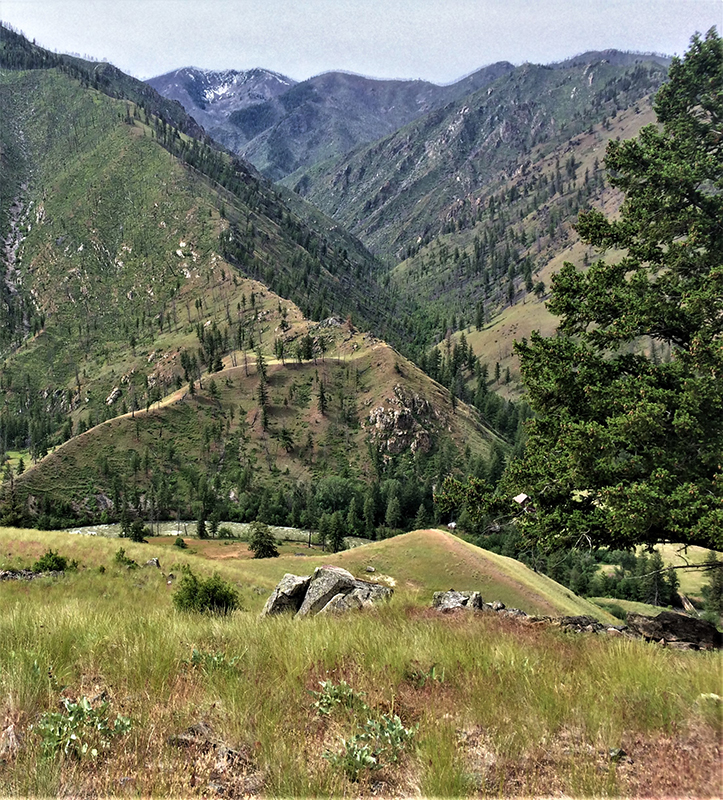
Figure 4 – Large, uninterrupted protected areas are needed to support species richness of wide-ranging mammals. At 2,358,940 acres, the Frank Church-River of No Return Wilderness is the largest undivided wilderness area in the contiguous United States.
Amphibians and reptiles, which we demonstrated are underrepresented in wilderness areas, have smaller ranges compared to large mammals and birds, but there are many mammals and birds that have small ranges. Of the 359 mammal species we assessed only 19 have large ranges. Species with small ranges or fine-scale variation in range may not be captured by the coarseness of the biodiversity data (i.e., 6.2 miles [10km]; Jenkins et al. [2015]). Just over 51% (368) of the wilderness areas in CONUS are smaller than the area of one pixel (i.e., 38.6 mi2 [100 km2]). Therefore, uncertainty exist in our results, particularly for topographically complex areas where species richness might vary within a pixel.
Areas of Concern and Opportunity
Even though many wilderness areas and protected areas were not established to protect the representation of biodiversity, the value of an ecologically represented system has long been recognized. However, additions to the global and national protected area network have not increased representation (Aycrigg et al. 2013; Watson et al. 2014). Dietz et al. (2015) found that even though the NWPS has expanded during the last 50 years, it has not achieved full representation of ecological systems found on federal lands. Our results indicate that in addition to ecological systems not being fully represented within wilderness, amphibians and reptiles are underrepresented, while birds and mammals are not fully represented at all levels of species richness. Therefore, there are areas of concern and opportunity within the NWPS.
Areas of concern have low species richness and few wilderness areas as well as few protected areas. We found the lowest representation of species richness in the southeastern United States (for both total and endemic species richness) and the southwestern United States (especially southern Arizona). Because our results support the findings of Aycrigg et al. (2013), Dietz et al. (2015), Jenkins et al. (2015), Aycrigg et al. (2016), and Dietz et al. (2020) there is growing evidence that if biodiversity representation is an important metric of overall species conservation then these areas are a priority.
To evaluate opportunities for increasing representation within the NWPS, Aycrigg et al. (2016) simulated the expansion of the NWPS by adding lands eligible for wilderness designation. The area of concern within southern Arizona could increase in representation if any of the following federal land designation were added to the NWPS: national park lands that have yet to be designated wilderness, lands managed so as not to degrade their wilderness character, US Department of Agriculture Forest Service Inventoried Roadless Areas, or Bureau of Land Management (BLM) roadless lands. The greatest amount of representation would be gained by including the BLM roadless lands, which total 72.3 million acres (29.3 million ha).
New wilderness areas in the southwestern United States would support greater representation of species richness, particularly reptiles (Figure 2). But there are other tangible advantages to designating new protected areas in that region. Studies such as Belote et al. (2016) have highlighted the need for connectivity between wilderness areas to facilitate the movement of species with large ranges. In their study, they found the greatest opportunities for protection of corridors in federal lands. Large amounts of federal land in the southwestern United States managed for multiple use are permanently protected, but allow for extraction of natural resources (i.e., energy development, logging). If the emphasis of management was shifted more toward species conservation on some lands managed for multiple use, then within the protected area network representation of species could be increased. Aycrigg et al. (2013) found with a management shift toward conservation, the percent area protected for ecological systems could be increased by up to 39%. Dietz et al. (2020) demonstrated significant opportunities for conservation on publicly managed multiple use lands for 91 species of conservation concern in the southwestern United States.
Another advantage of expanding biodiversity protection in the southwestern United States is the opportunity to capture high diversity hotpots in small areas. The sky islands of southern Arizona and New Mexico fit this criterion due to high topographic diversity resulting in many ecosystems in close proximity and high biodiversity (McCormack et al. 2009; Spector 2002). Spector (2002) notes that preserving biodiversity at biogeographic crossroads, such as the sky islands, can be a strategic way to gain biodiversity representation by capturing diverse species and communities in a concentrated area (Figure 5). The opportunity to increase biodiversity representation, maintain corridors between wilderness areas, and protect biodiversity hotspots suggest that the southwestern United States should be a high priority for future efforts to protect biodiversity.
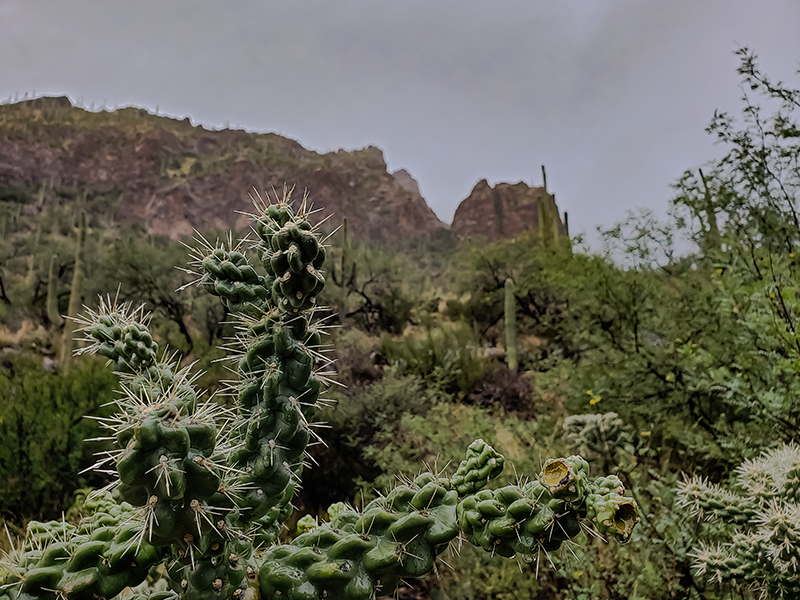
Figure 5 – The Pusch Ridge Wilderness near Tucson, Arizona, is an example of a protected sky island. The high topographic diversity (6,000 feet in under 6 miles) results in high biodiversity due to the many ecosystems, including desert canyons (pictured).
There are also some opportunities in the southeastern United States to protect corridors (Belote et al. 2016) and to increase conservation in multiple use federal lands (Dietz et al. 2020). However, strategies must be different due to the significantly smaller proportion of federal lands in the region. Aycrigg et al. (2013), Jenkins et al. (2015), and Belote et al. (2016) all suggest establishing and maintaining public and private conservation partners to increase biodiversity representation in the southeastern United States. Any form of additional protection will be valuable, though, as this region represented the highest levels of species richness for amphibians and reptiles, which we demonstrated were the least represented in wilderness areas (Figure 2). The southeastern United States also included the highest levels of species richness for all endemic species in our study (Figure 3), suggesting additional conservation importance. Mittermeier et al. (2003) highlight the global importance of targeting endemic species for protection due their irreplaceability. In the southeastern United States there is both a need to protect endemic species and increase biodiversity representation, as well as the opportunity to maintain corridors and establish joint public and private protected lands.
Conclusions
Wilderness areas are highly protected areas, which have a role in species conservation. One way to gauge species conservation is to assess biodiversity representation using species richness. Our results demonstrate that overall, for both total and endemic richness, amphibians and reptiles are the most underrepresented in wilderness, while birds and mammals are adequately represented on average. Therefore, the greatest need for improvement is greater protection in areas of high amphibian and reptile biodiversity. However, the comparison of frequency distributions and spatial assessment of geographic patterns suggest that some levels of species richness for birds and mammals are underrepresented. We further identify two regions that should be prioritized for increased biodiversity representation: the southwestern United States (especially southern Arizona) and the southeastern United States. Within these regions there exist opportunities to strengthen biodiversity representation, maintain corridors between wilderness areas, and add protected areas through the increased level of protection for federal lands and/or public-private land partnerships. The results of this study can also be used to inform federal land management plans for wilderness areas and other public lands at the national level..
About the Authors
T. RYAN McCARLEY is a research support scientist in the Department of Fish and Wildlife Sciences, College of Natural Resources at the University of Idaho; e-mail: tmccarley@uidaho.edu.
JOCELYN L. AYCRIGG is a landscape and wildlife ecology professor in the Department of Fish and Wildlife Sciences, College of Natural Resources at the University of Idaho; e-mail: aycrigg@uidaho.edu.
References
Aycrigg, J. L., A. Davidson, L. K. Svancara, K. J. Gergely, A. McKerrow, and J. M. Scott. 2013. Representation of ecological systems within the protected areas network of the continental United States. PLoS One 8. https://doi.org/10.1371/journal.pone.0054689.
Aycrigg, J. L., J. Tricker, R. T. Belote, M. S. Dietz, L. Duarte, and G. H. Aplet. 2016. The next 50 years: Opportunities for diversifying the ecological representation of the National Wilderness Preservation System within the contiguous United States. Journal of Forestry 114, 396–404. https://doi.org/10.5849/jof.15-050.
Belote, R. T., M. S. Dietz, B. H. McRae, D. M. Theobald, M. L. McClure, G. H. Irwin, P. S. McKinley, J. A. Gage, and G. H. Aplet. 2016. Identifying corridors among large protected areas in the United States. PLoS One 11, e0154223. https://doi.org/10.1371/journal.pone.0154223.
Bjornlie, D. D., F. T. Van Manen, M. R. Ebinger, M. A. Haroldson, D. J. Thompson, and C. M. Costello. 2014. Whitebark pine, population density, and home-range size of grizzly bears in the Greater Yellowstone Ecosystem. PLoS One 9: e88160. https://doi.org/10.1371/journal.pone.0088160.
Bleich, V. C. 2016. Wildlife conservation and wilderness: Wishful thinking ? Natural Areas Journal 36: 202–206. https://doi.org/
Cardinale, B. J., J. E. Duffy, A. Gonzalez, D. U. Hooper, C. Perrings, P. Venail, A. Narwani, G. M. MacE, D. Tilman, D. A. Wardle, A. P. Kinzig, G. C. Daily, M. Loreau, J. B. Grace, A. Larigauderie, D. S. Srivastava, and S. Naeem. 2012. Biodiversity loss and its impact on humanity. Nature 486: 59–67. https://doi.org/10.1038/nature11148.
Dawson, C .P., and J. C. Hendee. 2009. Wilderness Management: Stewardship and Protection of Resources and Values, 4th ed. Golden, CO: Fulcrum Publishing.
Dietz, M. S., R. T. Belote, G. H. Aplet, and J. L. Aycrigg. 2015. The world’s largest wilderness protection network after 50 years: An assessment of ecological system representation in the U.S. National Wilderness Preservation System. Biological Conservation 184: 431–438. https://doi.org/10.1016/j.biocon.2015.02.024.
Dietz, M. S., R. T. Belote, J. Gage, and B. A. Hahn. 2020. An assessment of vulnerable wildlife, their habitats, and protected areas in the contiguous United States. Biological Conservation 248: 108646. https://doi.org/10.1016/j.biocon.2020.108646.
Diniz-Filho, J. A. F., P. Carvalho, L. M. Bini, and N. M. Tôrres. 2005. Macroecology, geographic range size–body size relationship and minimum viable population analysis for new world carnivora. Acta Oecologica 27: 25–30. https://doi.org/10.1016/j.actao.2004.08.006.
Dudley, N., ed. 2008. Guidelines for Applying Protected Area Management Categories. Gland, Switzerland: International Union for Conservation of Nature.
Gaston, K. J. 1996. Species-range-size distributions: Patterns, mechanisms and implications. Trends in Ecology and Evolution 11: 197–201. https://doi.org/10.1016/0169-5347(96)10027-6.
Graham, K., and G. B. Stenhouse. 2014. Home range, movements, and Denning chronology of the grizzly bear (Ursus arctos) in West-Central Alberta. The Canadian Field-Naturalist 128: 223–234.
Jenkins, C. N., K. S. Van Houtan, S. L. Pimm, and J. O Sexton. 2015. US protected lands mismatch biodiversity priorities. Proceedings of the National Academy of Science 112: 5081–5086. https://doi.org/10.1073/pnas.1418034112.
Jones, K. R., O. Venter, R. A. Fuller, J. R. Allan, S. L. Maxwell, P. J. Negret, and J. E. M. Watson. 2018. One-third of global protected land is under intense human pressure. Science (80-. ). 360: 788–791. https://doi.org/10.1126/science.aap9565.
Jones, N. F., L. Pejchar, and J. M. Kiesecker. 2015. The energy footprint: How oil, natural gas, and wind energy affect land for biodiversity and the flow of ecosystem services. Bioscience 65: 290–301. https://doi.org/10.1093/biosci/biu224.
La Sorte, F. A., D. Fink, W. M. Hochachka, J. L. Aycrigg, K. V. Rosenberg, A. D. Rodewald, N. E. Bruns, A. Farnsworth, B. L. Sullivan, C. Wood, and S. Kelling. 2015. Documenting stewardship responsibilities across the annual cycle for birds on U.S. public lands. Ecological Applications 25: 39–51. https://doi.org/10.1890/14-0702.1.
Landry, M., V. G. Thomas, and T. D. Nudds. 2001. Sizes of Canadian national parks and the viability of large mammal populations: Policy implications. George Wright Forum 18: 13–23.
Mattson, D. 1997. Wilderness-dependent wildlife. International Journal of Wilderness 3: 34–38.
McCormack, J. E., H. Huateng, and L. L. Knowles. 2009. Sky islands. In Encyclopedia of Islands, ed. R. G. Gillespie and D. A. Clague (p. 1111). Berkeley and Los Angeles: University of California Press.
Mittermeier, R. A., C. G. Mittermeier, T. M. Brooks, J. D. Pilgrim, W. R. Konstant, G. A. B. da Fonseca, and C. Kormos. 2003. Wilderness and biodiversity conservation. Proceedings of the National Academy of Science 100: 10309–10313. https://doi.org/10.1073/pnas.1732458100.
Newbold, T., L. N. Hudson, A. P. Arnell, S. Contu, A. De Palma, S. Ferrier, S. L. L. Hill, A. J. Hoskins, I. Lysenko, H. R. P. Phillips, V. J. Burton, C. W. T. Chng, S. Emerson, D. Gao, G. Pask-Hale, J. Hutton, M. Jung, K. Sanchez-Ortiz, B. I. Simmons, S. Whitmee, H. Zhang, J. P. W. Scharlemann, and A. Purvis. 2016. Has land use pushed terrestrial biodiversity beyond the planetary boundary? A global assessment. Science (80-. ). 353: 288–291. https://doi.org/10.1126/science.aaf2201.
Rodrigues, A. S. L., S. J. Andelman, M. L. Bakarr, L. Boltani, T. M. Brooks, R. M. Cowling, L. D. C. Fishpool, G. A. B. de Fonseca, K. J. Gaston, M. Hoffman, J. S. Long, P. A. Marquet, J. D. Pilgrim, R. L. Pressey, J. Schipper, W. Sechrest, S. N. Stuart, L. G. Underhill, R. W. Waller, M. E. J. Watts, and X. Yan. 2004. Effectiveness of the global protected area network in representing species diversity. Nature 428: 640–643. https://doi.org/10.1038/nature02422
Sarkar, S. 1999. Wilderness preservation and biodiversity conservation – keeping divergent goals distinct. Bioscience 49: 405–412.
Scott, J. M., F. W. Davis, R. G., McGhie, R. G. Wright, C. Groves, and J. Estes. 2001. Nature reserves: Do they capture the full range of America’s biological diversity? Ecological Applications 11: 999–1007. https://doi.org/10.1890/1051-0761(2001)011[0999:NRDTCT]2.0.CO;2.
Shaffer, M. L., and B. A. Stein. 2000. Safeguarding our precious hertiage. In Precious Heritage: The Status of Biodiversity in the United States, ed. B. A. Stein, L. S. Kutner, and J. S. Adams (pp. 301–321). New York: Oxford University Press.
Spector, S. 2002. Biogeographic crossroads as priority areas for biodiversity conservation. Conservation Biology 16: 1480–1487. https://doi.org/10.1046/j.1523-1739.2002.00573.x.
US Public Law 88–577, 1964. The Wilderness Act of September 3, 1964.
Van Dyke, F. 2008. Conservation Biology: Foundations, Concepts, and Applications, 2nd ed. New York: Springer.
Watson, J. E. M., N. Dudley, D. B. Segan, and M. Hockings. 2014. The performance and potential of protected areas. Nature 515: 67–73. https://doi.org/10.1038/nature13947.
Read Next

What We Have and What We Need
As we reach the end of the 26th volume of the International Journal of Wilderness, it is worthwhile to reflect on this year that was 2020.
A Tribute to Michael Soulé
The following is a tribute to the life and contributions of Michael Soulé from several colleagues and friends.
The Preservation Paradox: How to Manage Cultural Resources in Wilderness? An Example from the National Park Service
At the same time that federal agencies must comply with protection measures of the Wilderness Act, federal cultural resource laws require agencies to take into account the effects of federal undertakings on cultural resources.