© Morgan Heim
A Spatial Demographic Approach to Wilderness Management
Science & Research
April 2018 | Volume 24, Number 1
PEER REVIEWED
ABSTRACT This work provides a framework for identifying wilderness areas most at risk from recreation impacts, now and in the future. By considering metropolitan area–specific population dynamics, this research highlights the utility of applying a spatial demographic approach to wilderness research and management. This analysis suggests that by 2060, day visits to US Forest Service (FS) wilderness areas may increase by 80% from the top 24 metropolitan area populations that visit wilderness areas the most. The largest increases will likely occur in the US Southwest and Central regions, areas with ecosystems vulnerable to trampling and projected to experience severe drought events due to climate change.
According to survey data collected by the US Forest Service between 2011 and 2014 as part of the National Visitor Use Monitoring (NVUM) program, more than half of all Forest Service wilderness visits were day visits (USDA 2016a). This leads to use that is heavily concentrated in “front country” areas (those within the first few miles of wilderness boundaries and easily reached in a day visit) (USDA 2016a). Increasingly, Americans are migrating to large metropolitan (metro) areas, according to analysis of county-level migration data from the Applied Population Laboratory, University of Wisconsin–Madison (Winkler et al. 2013). The additive pressures of a changing climate and increases in visitor use are creating new challenges for wilderness managers (Dawson et al. 2016). These stressors are likely to increase as the US population continues to grow (US Census 2016a), particularly in large metro areas close to wilderness areas.
Drawing on wilderness visit data from the NVUM survey, population data from the US Census (US Census 2016c), and county-level net migration data from the University of Wisconsin–Madison Applied Population Laboratory (Winkler et al. 2013), this article explores day use in wilderness areas that are near metropolitan area populations. By examining current levels of day use and forecasting future use, this analysis provides managers with a clearer vision of which urban populations are actively using wilderness areas today and probable future changes. A discussion of wilderness area ecosystem types and drought risk highlights wilderness area hotspots – locations both ecologically vulnerable to increased visitor use and where population pressures are forecast to become particularly severe in the coming decades.
Data and Methods
Assessing Current Forest Service Wilderness Day Use by Metropolitan Area
Data from the NVUM dataset 2010–2014 (USDA 2016a) were used to estimate wilderness visitation rates. These data are collected on each FS administrative unit every five years. Local metro populations were defined as those metro area residents traveling fewer than 150 miles (241 km) to reach the start of their wilderness experience. The 150-mile distance threshold (a maximum of approximately three hours in each direction) ensures all metro areas within comfortable driving distance of wilderness areas are included. Respondent-provided zip codes were matched to metro areas using the US Census zip code to metro area crosswalk (US Census 2016d). Day visits were identified as visits that began and ended on the same calendar day. A metropolitan area includes both urban and suburban areas and is defined by the US Census as an area with a core urban area with a population of at least 50,000. Only metropolitan areas with at least 20,000 annual day visits to wilderness areas were included in the analysis. This figure of 20,000 visits was selected as a cutoff to determine which metro areas would qualify as top users of Forest Service wilderness. The 20,000-visit cutoff provides a frame for focusing the analysis on the highest user metro areas, resulting in a short, yet comprehensive list for managers interested in understanding which metro area populations have the most wilderness day use. Twenty-four metro area populations met the 20,000-day visit threshold.
Looking ahead: wilderness day use through 2060
While the US population is expected to grow by 30% between 2015 and 2060, there are considerable variations in growth rates by metro area. Metro area populations were projected using the cohort-component method (Smith 1986). The cohort-component method draws on the current population levels, births, deaths, and net migration to forecast future population levels, according to the following basic demographic balancing equation:
P(t+n) = P(t) + B(t) − D(t) + I(t) − E(t)
P(t) is the population at time t
B(t) and D(t) are number of births and deaths occurring between t and t+n.
I(t) and E(t) are the number of immigrants and of emigrants from the county during the period t to t+n (UNFPA 2017)
In this analysis, births and deaths were estimated using national 2010 fertility rates (Martin et al. 2013) and 2010 mortality rates (Arias 2014), respectively. Net migration rates were estimated using age-specific, county-level net migration rates (Winkler et al. 2013). Population counts were drawn from the American Community Survey 2010–2014 (US Census Bureau 2016a).
The age-specific day-use visitation rates for each metro area were calculated using NVUM data and metro area population counts. Due to small sample sizes in the NVUM data, it was not possible to disaggregate metro area visits by age-specific gender categories (e.g., visits by 20- to 24-year-old females from Salt Lake City) and still provide reliable estimates. As such, both male and female visits were aggregated into four larger, unisex age brackets: 0–19, 20–49, 50–69, and 70 and above. There were statistically significant differences in average visitation rate (visits per 1,000 population) by age bracket, justifying the use of age-specific rates in the forecast. Average rates were 0–19 (18 per 1,000), 20–49 (72 per 1,000), 50–69 (82 per 1,000), and 70+ (31 per 1,000). The 50–69 rate was not used in the forecast to correct for a potentially inflated baby-boomer (age 50–69) visitation rate effect, which will no longer apply in the future. This effect is the notion that the baby boomer generation is more closely tied to wilderness and visits wilderness areas at a higher rate than younger generations (Bowker et al. 2006; Green 2006). To avoid a possible overestimation of visits by 50- to 69-year-olds in the future, the 20–49 rate is applied to those aged 50–69. Results are mapped (see Figures 1 and 2) using ArcGIS software, US Census, and USDA spatial data files (US Census 2015; USDA 2015).
The forecasting process is detailed below:
- Using 2010 population counts from the US Census as the base, the population of the metro area was projected, at five-year intervals (2015, 2020, 2025 … 2060), using the cohort-component method at five-year age intervals (0, 5, 10, 15 … 85) in STATA software. The cohort-component method was applied using observed, age-specific female fertility rates, age-specific male and female mortality rates, and overall age-specific migration rates.
- Using NVUM visitor data from 2011 to 2014, all visits to wilderness areas from respondents who reported a given metro area zip code were weighted and aggregated into four age groups: 0–19, 20–49, 50–69, and 70 and above. Using 2010 population levels, the age-specific visitor rate was calculated according to the following equation:
- Age-specific visitor rate = Total weighted, reported visits in the given age category/observed total population within age category
- To obtain the forecast of visits for 2060, the age-specific visitor rates for 0–19, 20–49, and 70 and above were applied as follows:
- Total population aged 0–19 x age-specific visitation rate for 0–19 = projected visits from residents aged 0–19
- Total population aged 20-49 x age-specific visitation rate for 20–49 = projected visits from residents aged 20–49
- Total population aged 50–69 x age-specific visitation rate for 20–49 = projected visits from residents aged 50–69
- Total population aged 70 and above x age-specific visitation rate for 70 and over = projected visits from residents aged 70 and above
- Total projected visits from residents aged 0–19, 20–49, 50–69, and 70 and above are aggregated to obtain the final estimate of day visits to wilderness areas by residents in 2060.
Results
The metro area population, annual estimated day visits, and visits per 1,000 population are listed in Table 1, ranked by number of visits. Table 2 lists projected visits by metro area for 2030 and 2060, ranked in order of projected percent increase in visits. Table 3 lists the Forest Service units by current and projected day use in wilderness areas from local, metro populations and the percent change in projected visits from the current levels to 2060.
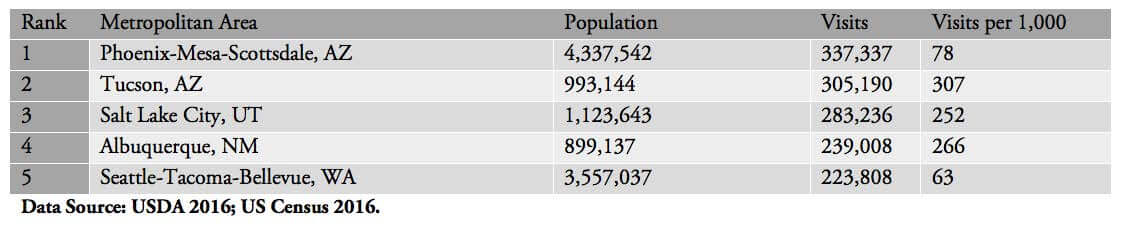
Table 1 – Day use visits to Forest Service Wilderness Areas by Metropolitan Area (abridged)
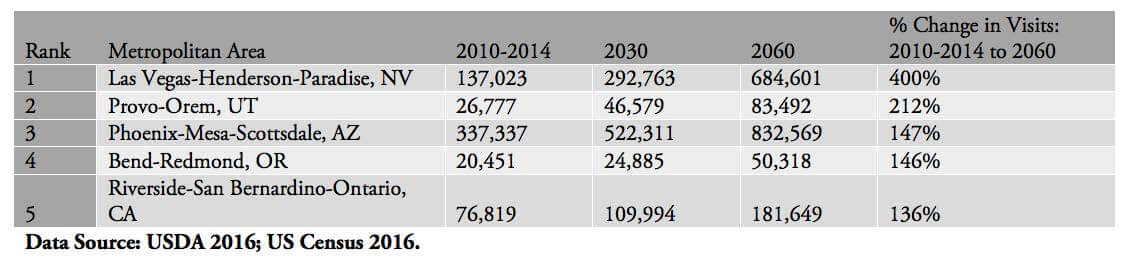
Table 2 – Total Annual Day Visits to Forest Service Wilderness Areas: 2010-2014 (actual), 2030 and 2060 (projected),
by Metro area (abridged)

Table 3 – Day visits to Forest Service Wilderness by local, metro area residents (2010-2014, 2030 and 2060) (abridged)
Figure 1 displays visits from 2011 to 2014 by metro area, and Figure 2 shows projected change in day use by FS administrative unit, on a percentage basis. The increase in day use is not evenly distributed across the United States. The South, Southwestern regions, and Central Plains regions of the country are projected to experience the most significant population growth in the coming decades, and, as a result, national forest units with wilderness areas close to these growing metro areas will likely see considerable rises in day use. While migration estimates may shift in the coming years, the current data suggest percent increases in day use in the double- and even triple-digit range.
Discussion
Day use of Forest Service wilderness areas by the top 24 metro area user populations is expected to increase by 80% between 2010–2014 and 2060, an increase of more than 2 million visits. The field of recreation ecology provides insight into how visitor use can impact wilderness areas. The four key potential impacts are trampled vegetation, soil erosion, altered water quality, and disruption of wildlife (Marion et al. 2016). Moderate to heavy trampling (the act of treading on and crushing) can lead to loss of vegetation cover and change in vegetation composition. Impacts to soils include soil compaction, which may cause increased runoff during heavy rains, which may starve vegetation of the water it needs to survive. Soil erosion is also a key concern, as it leads to decreased soil moisture (Marion et al. 2016).
Forests, shrubs, grasslands, and desert ecosystems make up 90% of the wilderness areas examined (USGS GAP 2011), and are all highly vulnerable to trampling (Hill and Pickering 2009; Marion and Cole 1996; Monz, Pickering, and Hadwen 2013; Pescott and Stewart 2014). The wilderness areas in six Forest Service units that are expected to see the largest number of visits from local, urban populations by 2060 (more than 300,000 visits annually) comprise mainly forest or desert ecosystems, and are in four Southwestern and Central Plains states: Nevada, Utah, Arizona, and New Mexico. The Southwestern and Central Plains regions, including the states of Utah, Nevada, Arizona, and New Mexico, are also projected to experience the most severe drought impacts between 2050 and 2099 (Cook, Ault, and Smerdon 2015). Soils in these areas, already sensitive to trampling due to lack of soil moisture (Burns, Ward, and Downs 2013), will have an even harder time recovering from trampling effects in times of severe drought. Loss of soil moisture will also make conditions difficult for sensitive vegetation to regenerate. Table 4 lists these six FS unit hotspots.
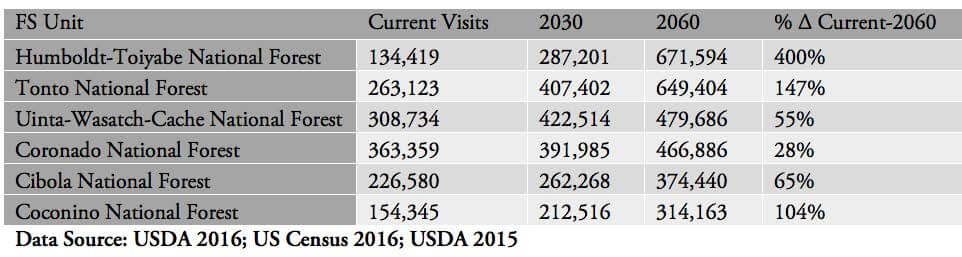
Table 4 – Wilderness Area Hotspots: Forest Service units in drought prone areas expected to see over 300,000 annual day visits from local, urban populations by 2060
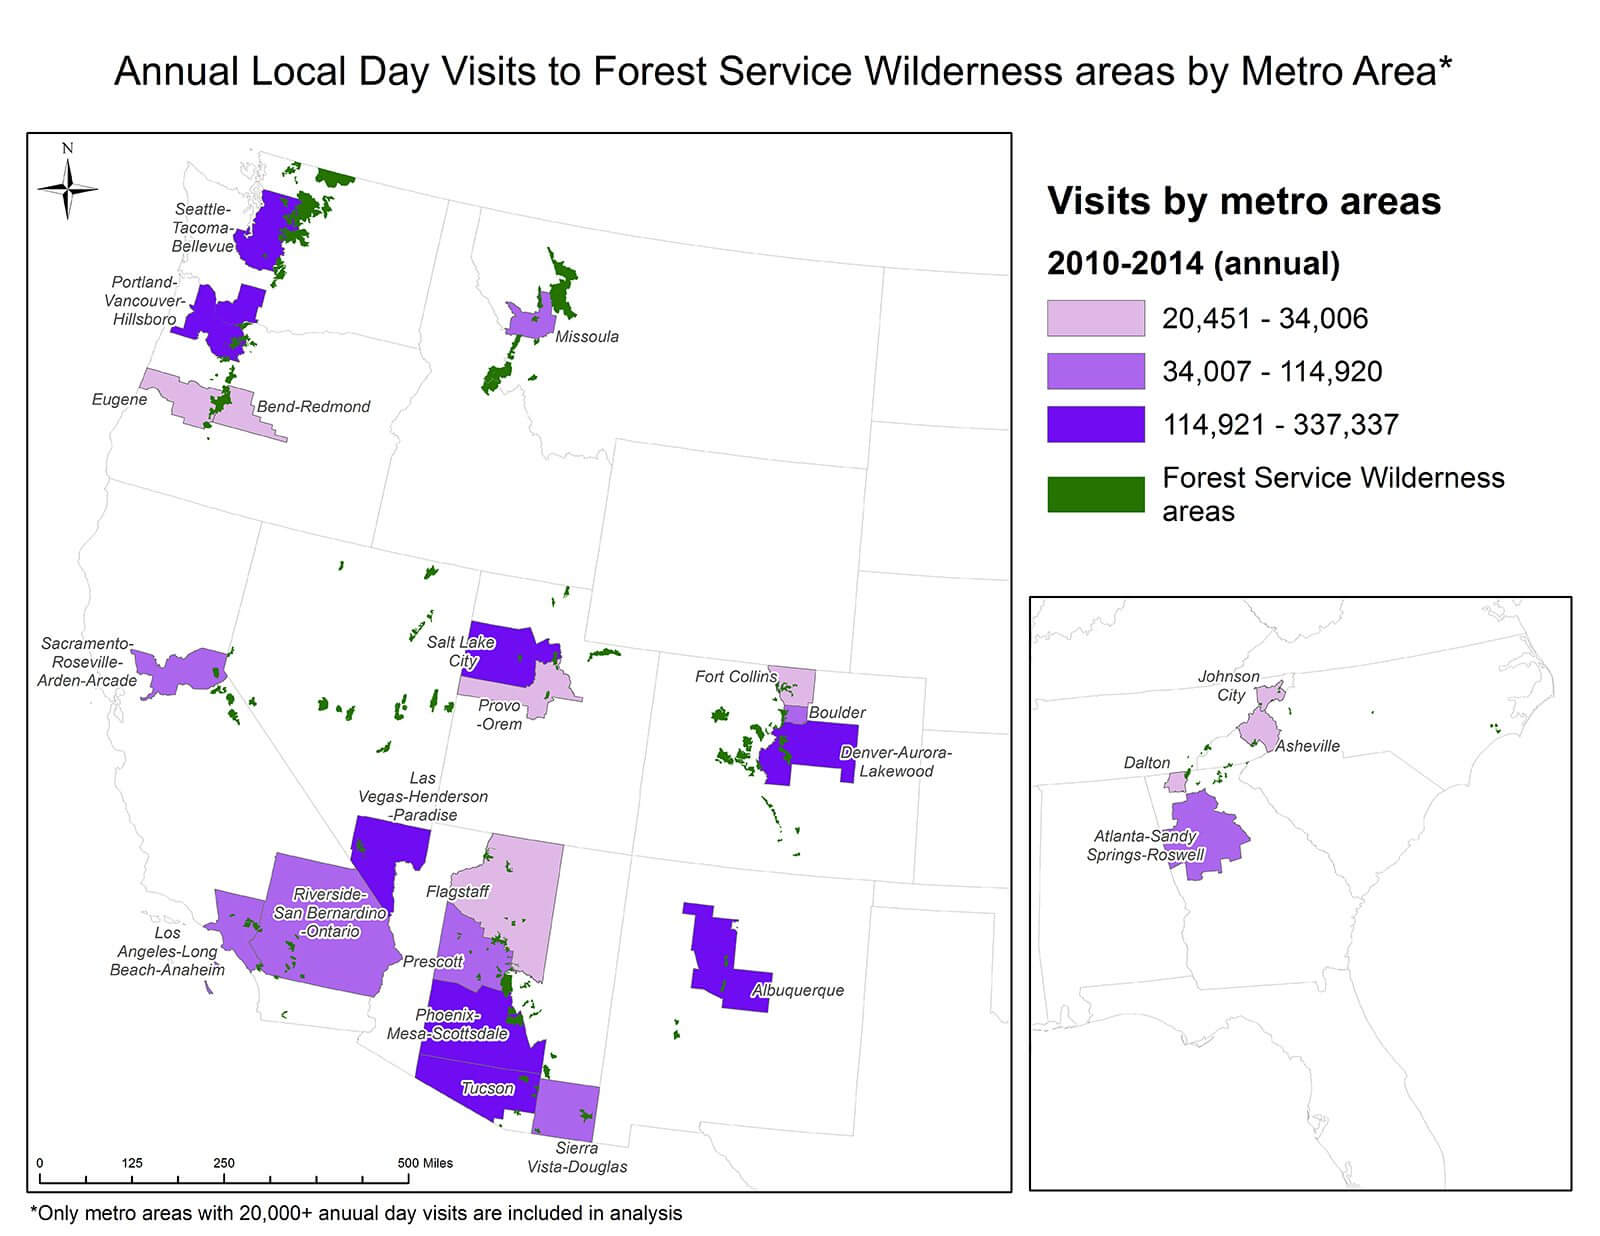
Figure 1 – Annual Day Visits to Forest Service Wilderness Area by Local Metro Area Residents (2010-2014)
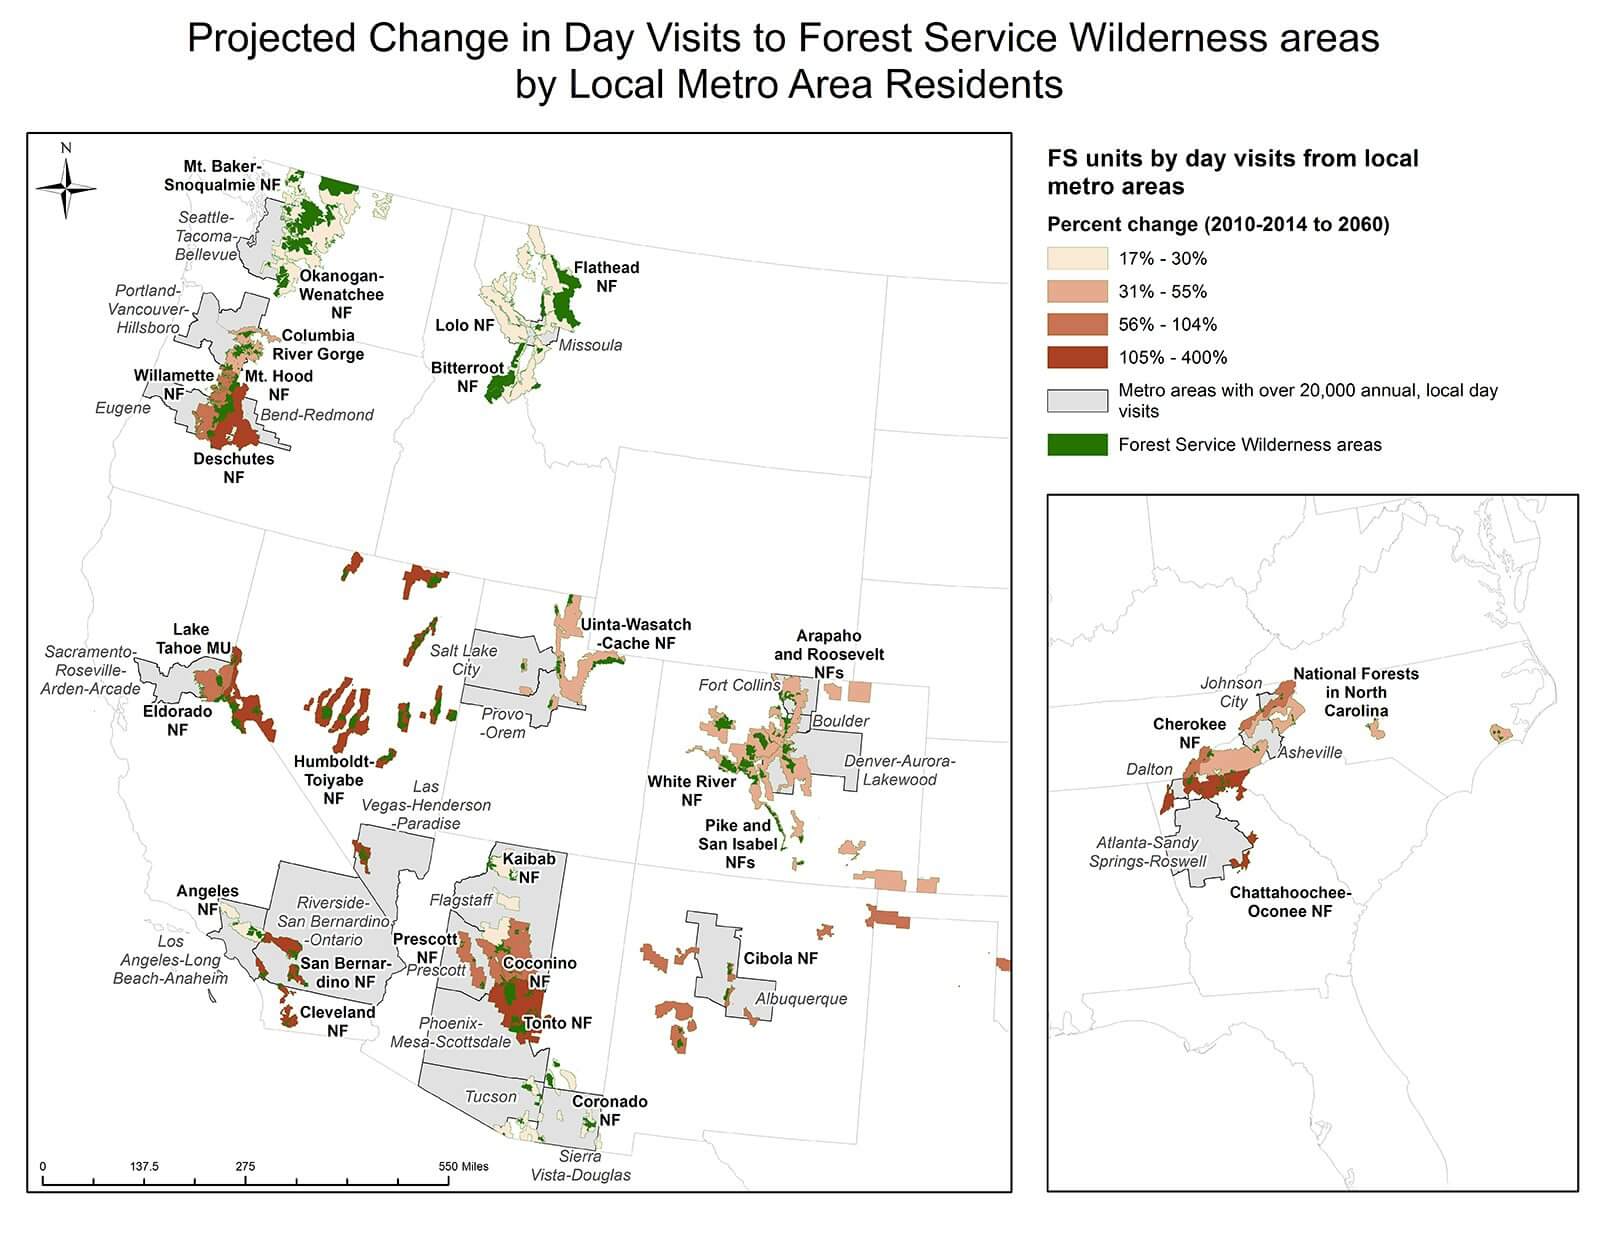
Figure 2 – Projected change in day visits to Forest Service Wilderness areas by local, metro area residents
Many of the current wilderness recreation user guidelines are geared toward overnight visits and may not apply to urban day users. Wilderness managers may need to redevelop guidelines to ensure that user recommendations are comprehensible to urban day users and relevant in times of severe drought. In addition to ramping up education efforts, stewardship groups may also consider reaching out to these metro populations directly for support, either in-kind, such as trail maintenance projects, or monetary donations. Organizations that provide opportunities for children and young adults to visit wilderness may need to refocus efforts to promote not just the wilderness experience but also the value of wilderness preservation. This preservation message could be tailored to wilderness users and nonusers alike, and disseminated using easily accessible, multimedia technologies. Projects such as the short film Untrammeled (USDA 2016b), which highlights the experience of Montana youth in the Bob Marshall Wilderness, are an important step in this direction.
Identifying and targeting messages to urban populations is only one piece of the puzzle. The other key component is preparing administrative units for the impending influx of visits. The first step is educating unit managers about the forecasted increase in visits in the coming decades. While some wilderness areas only draw urban visitors from a single metro area, other units that are more centrally located need to consider how increasing populations in multiple metro areas may affect wilderness day use. A next step may be increasing public-private partnerships that can implement projects that maintain and/or restore wilderness character.
Untrammeled is an inspiring 27-minute film about passing the torch for wilderness to the next generation. Learn more here >
Conclusion
This article examined current day use of wilderness areas from local metro area populations and employed a spatial demographic approach to forecast how population dynamics may affect wilderness landscapes in the future. The research reported here provides managers with a better understanding of which metro area populations are currently the largest source of National Forest wilderness day use visits and identifies probable future wilderness use hot spots. Wilderness managers and advocates can employ these data to better target their base of supporters and communicate important messages around careful stewardship of this treasured wilderness resource.
DR. REBECCA RASCH is the regional social scientist for the Northern Region of the USDA Forest Service in Montana; email: rrasch@fs.fed.us
DR. BETH HAHN is the deputy director of the Aldo Leopold Wilderness Research Institute, Rocky Mountain Research Station of the USDA Forest Service in Montana; email: bhahn@fs.fed.us
References
Arias, E. 2014. National Vital Statistics Reports. United States Life Tables, 2010. National Vital Statistics System. U.S. Department of Health and Human Services. Retrieved from http://www.cdc.gov/nchs/data/nvsr/nvsr63/nvsr63_07.pdf.
Bowker, J. M., D. Murphy, H. K. Cordell, D. B. K. English, J. C. Bergstrom, C. M. Starbuck, C. J. Betz, and G. T. Green. 2006. Wilderness and Primitive Area Recreation Participation and Consumption: An Examination of Demographic and Spatial Factors. Journal of Agricultural and Applied Economics 38(2): 317-326.
Burns, B. R., J. Ward, and T. M. Downs. 2013. Trampling Impacts on Thermotolerant Vegetation of Geothermal Areas in New Zealand. Environmental Management 52(6): 1463–1473.
Cook, B. I., T. R. Ault, and J. E. Smerdon. 2015. Unprecedented 21st century drought risk in the American Southwest and Central Plains. Science Advances 1(1): E1400082.
Dawson, C. P., K. Cordell, A. E. Watson, R. Ghimire, and G. T. Green. 2016. The US Wilderness Managers Survey: Charting a Path for the Future. Journal of Forestry 114(3): 298–304.
Green, G. 2006. Wilderness and primitive area recreation participation and consumption: An examination of demographic and spatial factors. Journal of Agricultural Applied Economics 38(2):317–326.
Hill, W. and C. M. Pickering. 2009. Differences in the resistance of three subtropical vegetation types to experimental trampling. Journal of Environmental Management 90:1305–1312.
Marion, J. L., Y. F. Leung, H. Eagleston, and K. Burroughs. 2016. A Review and Synthesis of Recreation Ecology Research Findings on Visitor Impacts to Wilderness and Protected Natural Areas. Journal of Forestry 114(3): 352–362.
Marion, J. L., and D. N. Cole. 1996. Spatial and temporal variation in soil and vegetation impacts on campsites: Delaware Water Gap National Recreation Area. Ecological Applications 6(2):520–530.
Martin, J. A., B. E. Hamilton, M. J. K. Osterman, S. C. Curtin, and T. J. Mathews. 2013. National Vital Statistics Reports. Births: Final Data for 2013. National Vital Statistics System. U.S. Department of Health and Human Services. http://www.cdc.gov/nchs/data/nvsr/nvsr64/nvsr64_01.pdf (accessed 10 July 2016).
Monz, C.A., C. M. Pickering, and W.L. Hadwen. 2013. Recent advances in recreation ecology and the implications of different relationships between recreation use and ecological impacts. Frontiers in Ecology and the Environment 11(8):441–446.
Pescott, O. L., and G. B. Stewart. 2014. Assessing the impact of human trampling on vegetation: A systematic review and meta-analysis of experimental evidence. Peer J 2: e360.
Smith, S. K. 1986. Accounting for migration in cohort-component projections of state and local populations. Demography 23: 127.
UNFPA. 2017. Population Analysis for Policies and Programs. Cohort-component population projections. http://papp.iussp.org/sessions/papp101_s10/PAPP101_s10_060_010.html (accessed 1 May , 2017)
United States Census Bureau. 2015. TIGER/Line CBSA [shapefile]. http://www.census.gov/geo/maps-data/data/tiger-line.html (accessed 8 July 2016).
United States Census Bureau. 2016. Table 4: Population: 1790 to 1990. https://www.census.gov/population/censusdata/table-4.pdf (accessed 26 August 2016).
United States Census Bureau. 2016a. FAQ: What percentage of the U.S. population is urban or rural? https://ask.census.gov/faq.php?id=5000&faqId=5971 (accessed 26 August 2016).
United States Census Bureau. 2016b. American Community Survey. 2010-2014. Age and Sex. http://www.census.gov/programs-surveys/acs/ (accessed 3 October 2016).
United States Census Bureau. 2016c. Relationship Files. 2010 ZIP Code Tabulation Area (ZCTA) Relationship files. https://www.census.gov/geo/maps-data/data/relationship.html (accessed 3 October 2016).
United States Department of Agriculture (USDA) Forest Service. 2015. National Wilderness Preservation System [shapefile]. http://www.wilderness.net/NWPS/geography (accessed 10 July 2016).
United States Department of Agriculture (USDA) Forest Service. 2016. National Visitor Use Monitoring Survey (NVUM) FY 2010- FY 2014. Wilderness. http://apps.fs.fed.us/nfs/nrm/nvum/results/ (accessed 10 July 2016).
United States Department of Agriculture (USDA) Forest Service. 2016a. “Untrammeled.” Online video clip. YouTube. YouTube, 21 April 2016. Web. 24 August 2016.
US Geological Survey, Gap Analysis Program (USGS GAP). May 2011. National Land Cover, Version 2. http://gapanalysis.usgs.gov/gaplandcover/data/ (accessed 27 October 2016).
Winkler, R., K. M. Johnson, C. Cheng, J. Beaudoin, P. R. Voss, and K. J. Curtis. 2013. Age-Specific Net Migration Estimates for US Counties, 1950-2010. Applied Population Laboratory, University of Wisconsin- Madison. Web. [5 October 2016] < http://www.netmigration.wisc.edu/>.
Read Next

December 2018
In this issue of IJW, we remember the wilderness giant Stewart “Brandy” Brandborg. Betsy Lindley, Maria Blevins, and Scott Williams discuss cultural meanings and management challenges for urban-proximate wilderness areas. David Cole documents the historical development and evolution of the Leave No Trace program. Finally, Crista Valentino highlights the emergence of new conservation leaders with the CoalitionWILD program.

Apologizing for Science-Based Decision Making in Protected Area Management
Apologizing for science promotes autocratic management that can easily be commandeered by sociopolitical agendas and bureaucratic systems.

Wilderness Giant: Stewart “Brandy” Brandborg Moves on at 93
Steward Brandborg was a phenomenal wilderness champion, the last wilderness advocate with ties to most of the founders of the modern wilderness movement.