© Aaron Burden
Quantifying the Range of Variability in Wilderness Areas: A Reference When Evaluating Wilderness Candidates
Science & Research
August 2018 | Volume 24, Number 2
PEER REVIEWED
ABSTRACT The US Forest Service recently began revising forest management plans under the 2012 forest planning rule. The forest plan revision process includes a wilderness inventory and evaluation that can lead to some lands being recommended as wilderness. During this process, the Forest Service evaluates the wilderness character of candidate roadless lands. This evaluation can result in the disqualification of areas for wilderness recommendations based on degraded qualities of wilderness character. However, it is unknown how the wilderness character of candidate lands compares to conditions within the existing National Wilderness Preservation System (NWPS). Without such an evaluation and comparison, candidate areas for wilderness recommendation could be held to a higher standard of wilderness character than lands currently protected as wilderness. Here, four national mapped datasets representing qualities of wilderness character (human modification, distance to roads, light pollution, and noise pollution) of candidate roadless lands (also called wilderness candidates) were compared to the existing NWPS. The number of candidate areas that were more degraded than the most degraded wilderness area was counted. In addition, the distribution of values of wilderness candidates was compared with the distribution of values from areas of the NWPS. Data were analyzed at two scales: among all wilderness areas and within Forest Service regions. Among all wilderness areas, no wilderness candidate was more degraded than the range of conditions within the existing NWPS. Within regions, very few candidates were more degraded than current wilderness areas, irrespective of the metric evaluated. These results suggest that most candidates for wilderness recommendation fall within the range of conditions observed within the current NWPS. A similar approach to quantifying the range of conditions within existing wilderness could be used in local evaluations to ensure that candidates for wilderness are not held to a higher standard of wilderness character than that of the existing NWPS.
Wilderness areas of the National Wilderness Preservation System (NWPS) serve as core units of a national system of conservation reserves in the United States (Aycrigg et al. 2013, 2016a; Belote et al. 2016). As important as the existing NWPS is, additional reserves are needed to better represent ecological diversity (Dietz et al. 2015) and establish an ecologically-connected network of protected areas (Aycrigg et al. 2016b, Belote et al. 2017). Fortunately, a process exists whereby lands can be recommended to the US Congress for inclusion as new legislated wilderness areas. For example, during land management planning under the 2012 Planning Rule of the National Forest Management Act (USDA 2012), the Forest Service evaluates wilderness character of lands under Chapter 70 of the planning rule directives. Through this local inventory and evaluation process, the agency determines which candidate roadless lands (generally greater than 2,023 ha/4,999 acres) on each national forest maintain outstanding wilderness character and which areas should be recommended as wilderness.
Wilderness character is based on concepts outlined in the Wilderness Act including naturalness, undeveloped condition, untrammeledness, and outstanding opportunities for solitude or primitive recreation (Landres et al. 2015). Wilderness character is associated with the concept of wildness (Aplet 1999) and generally describes ecological conditions (e.g., integrity) and the degree of control humans assert on natural processes (e.g., through fire suppression and plant and animal management). Quantifying and mapping wilderness character of existing wilderness areas has occurred throughout the country using spatial data representing human impacts to qualities of land (Tricker et al. 2012, 2013, 2016, 2017; Burrows et al. 2016). Datasets used in these analyses have included features that represent built structures, distance to roads, and sights and sounds that impact wilderness character. These qualities are also closely related to conditions outlined for assessment in the directives of the wilderness inventory and evaluation process. In developing forest plan revisions, such wilderness inventory and evaluation are usually conducted at local scales across a single (or several adjacent) national forests.
Such local evaluations in conservation planning are a critical step for determining high-priority lands to include in formal ecological reserves (Pressey and Bottrill 2009). Local evaluations provide data necessary for managers to identify lands suitable or unsuitable for wilderness recommendations. Data on local roads, trails, structures, historical timber management, the presence of nonnative species, and other qualities must be evaluated to identify and prioritize places with high wilderness character. The importance of local evaluations notwithstanding, mapped national and global datasets increasingly provide opportunities to evaluate the importance of land based on a national or global perspective (Pouzols et al. 2014; Belote and Irwin 2017).
In some instances, local evaluations may result in the national or global significance of areas being overlooked (sensu Noss et al. 2015). For instance, features that degrade wilderness character at a local level (e.g., an old cabin or a patch of invasive species) could result in managers downgrading or disqualifying areas for consideration as new wilderness areas. However, the same candidate lands – when compared to all other lands in the nation – may be of extremely high value and represent some of the wildest remaining lands in the country. Only through a national or regional evaluation of candidates can such determination of relative quality be made (e.g., Belote and Irwin 2017).
Moreover, through the wilderness inventory and evaluation process some candidates for recommended wilderness may be downgraded because of features that reduce wilderness character (e.g., cabins, bridges), even though such features may occur in existing wilderness areas. The NWPS is widely regarded as a national and global treasure for maintaining America’s remaining wildlands (Cordell et al. 2005). Yet, candidates for future consideration may be held to a higher standard than the lands that currently make up the NWPS. During local evaluations of wilderness character, it is critical to evaluate candidates for future wilderness recommendations at a national scale and compare wilderness character of candidates with that of the existing NWPS.
Candidates for future consideration may be held to a higher standard than the lands that currently make up the NWPS
With the above concepts in mind, two primary questions were asked: (1) What is the range of variability in various metrics of wilderness character within the NWPS? (2) How do candidates for recommended wilderness compare to this range of variability?
Methods
Four metrics that serve as proxies for wilderness character were evaluated: human modification (Theobald 2013); distance to roads (National Park Service 2013); light pollution (Monahan et al. 2012); and noise pollution (Mennitt et al. 2014). These four metrics (Figure 1) are among several national datasets that represent qualities associated with wilderness character and wildness (sensu Aplet 1999; Aplet et al. 2000; Watson et al. 2016). These metrics have been used to map wilderness character in several wilderness areas in the United States, generally provide estimates of gradients in wilderness character (Tricker et al. 2012, 2013, 2016, 2017; Burrows et al. 2016), and represent nationally mapped data of relatively high resolution. Other national mapped datasets representing estimates of biological diversity priorities are also available (Dietz et al. 2015; Jenkins et al. 2015; Belote et al. 2017) and could be used to evaluate the importance of these candidate lands as means of better representing biodiversity (Aycrigg et al. 2015; Belote and Irwin 2017). The intent here was to focus on nationally available mapped data representing four qualities closely associated with measures of wilderness character (Landres et al. 2015).
Human modification data is based on land cover, human population density, roads, and other mapped metrics of ecological condition (Theobald 2013). Data are scaled from 0 (no measured human modification) to 1 (high degree of human modification). Distance to roads was calculated as the geographic distance (in meters) from all roads using Topologically Integrated Geographic Encoding and Referencing (TIGER) data available from the US Census (US Census Bureau 2015). This analysis was conducted with the EUCLIDEAN DISTANCE tool in ArcGIS 10.5, which resulted in gridded data where distance is assigned to each 90-meter resolution pixel for the contiguous US. Wilderness character is assumed to increase with distance from roads, although the decay of impact likely varies among ecosystems. Different types of roads are not differentiated here, as these differences are accounted for within the human modification data. Smaller distances are related to likely degraded wilderness character, based on increased human access, pervasive sights and sounds from the roads, and other ecological impacts associated with roads (Tricker et al. 2012; Burrows et al. 2016; Ibisch et al. 2016).
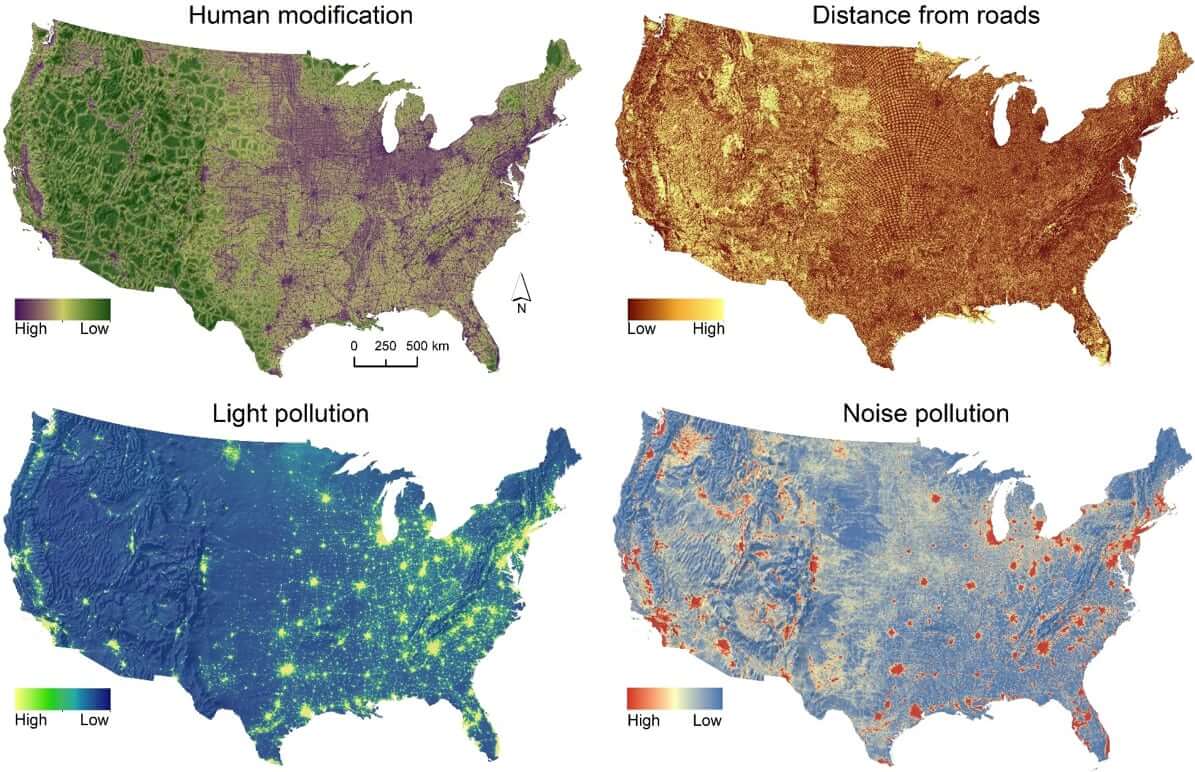
Figure 1 – Four datasets used as measures of wilderness character: human modification, distance to roads, light pollution, and noise pollution.
Light pollution represents satellite-measured light intensity during the night from the Visible Infrared Imaging Radiometer Suite (VIIRS) nighttime lights data (Nelson et al. 2015). This mapped dataset serves as a measure of the intactness of the night sky. Higher values represent more intense light pollution and thus lower wilderness character (Tricker et al. 2012). Similarly, mapped data of human-generated noise pollution is based on field observations and a spatial model using landscape features that influence sound propagation (Mennitt et al. 2014; Nelson et al. 2015). Greater intensity of human noises (higher predicted dBA) is associated with reduced wilderness character. The Forest Service 2012 Planning Rule directives on wilderness evaluations suggests that “sights and sounds from outside the area” should be considered when evaluating wilderness suitability of candidates. Data on light and sound pollution provide a national dataset to evaluate these qualities of wilderness character.
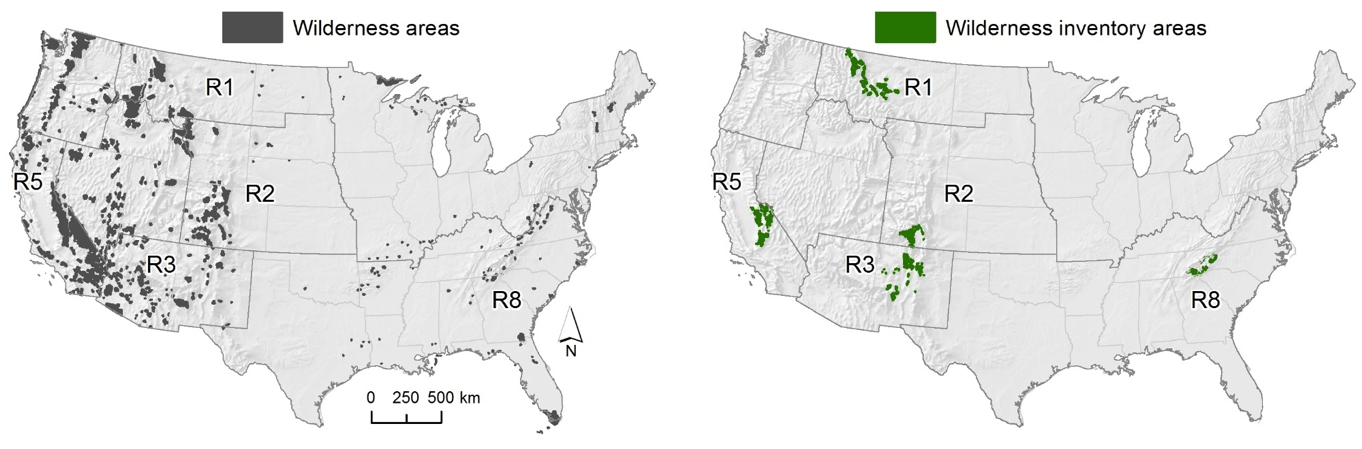
Figure 2 – The existing National Wilderness Preservation System and wilderness inventory areas (wilderness candidates) currently being evaluated among different Forest Service regions.
For each of the four qualities, data were extracted for all 683 existing wilderness areas of the NWPS within the contiguous United States, along with 300 wilderness inventory areas among 9 national forests. Summary statistics were then calculated for each unit (Figure 2). Hereafter, wilderness inventory areas are referred to as wilderness candidates, as they are among a pool of areas currently being considered for wilderness recommendations in national forest planning. The nine national forests included the Flathead and Helena-Lewis and Clark from the Northern Region (R1); the Cibola and Santa Fe from the Southwestern Region (R3); the Rio Grande from the Rocky Mountain Region (R2); the Sierra, Sequoia, and Inyo from the Pacific Southwest Region (R5); and the Nantahala-Pisgah from the Southern Region (R8). These areas were chosen because the Forest Service had completed identification of their candidate wilderness areas in these national forests at the time of our analysis. Candidate wilderness boundaries were obtained from local Forest Service staff. The mean distribution of each quality from all NWPS units in the lower 48 states was plotted using kernel density plots from the ggplot2 package in R. In addition, values from individual units were added as “rug plots” to evaluate the range for each quality. Data were also stratified based on Forest Service regions so that existing wilderness in different regions of the country were compared to candidates from the roadless area inventories in those same regions.
Because these data represent a census of all areas, inferential statistics (e.g., using analysis of variance) were not conducted. Instead, visual comparisons were made of the distributions of data using the kernel density plots. The number of wilderness candidate units with characteristics more degraded than the range observed within the NWPS among and within regions were also evaluated. In other words, the number of wilderness candidates with greater human modification, were closer to roads, or were exposed to higher levels of light and noise pollution than existing wilderness areas were counted. Finally, as a post hoc analysis, mean elevation of wilderness areas and wilderness candidates was compared using a national 30-meter resolution digital elevation model to potentially explain observed patterns in wilderness character metrics.
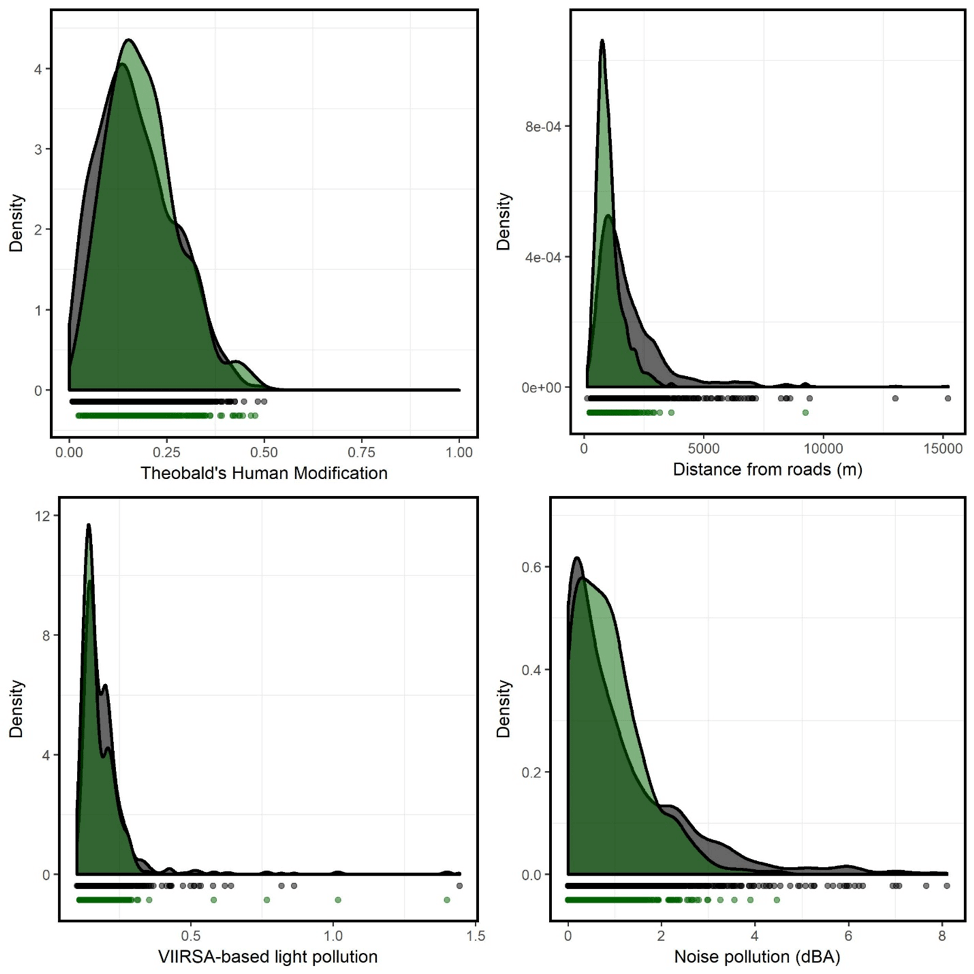
Figure 3 – Human modification, distance from roads, light pollution, and noise pollution for all wilderness areas (black) and all wilderness candidate areas to date (green). The overlap registers as dark green.
Results
When compared across the lower 48 states, all candidates for recommended wilderness were within the range of values observed within existing wilderness areas of the NWPS (Figure 3; Table 1). The kernel density distribution of values for each quality varied little when comparing wilderness areas with wilderness candidate areas, although wilderness areas tended to be farther from roads than wilderness candidate areas (Figure 3).
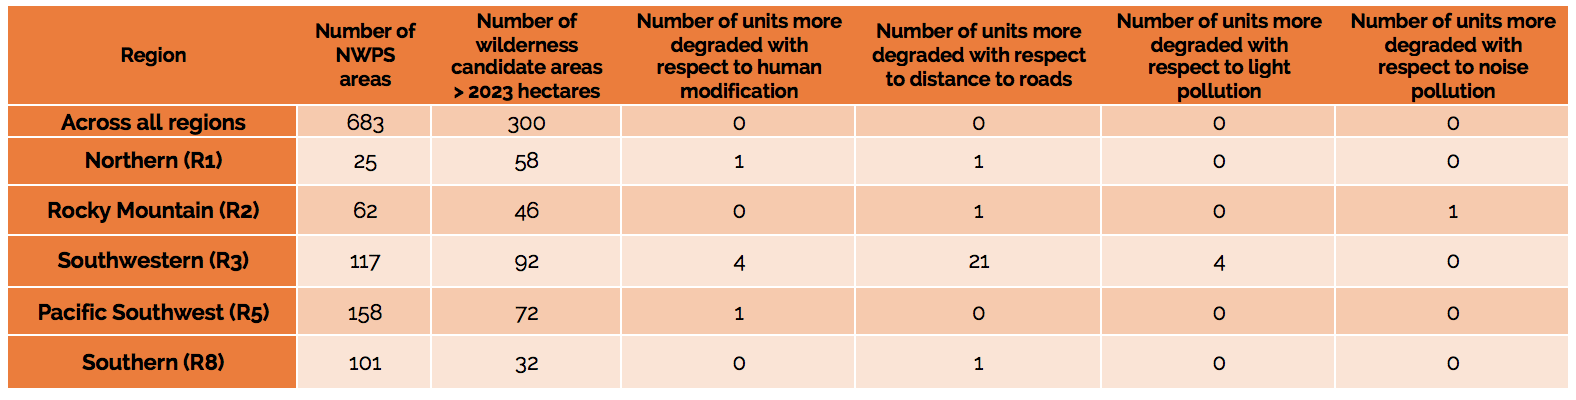
Table 1 – Number of wilderness candidates among five US Forest Service Regions and the number of those units that are more degraded compared to the range of values within existing wilderness areas of the NWPS.
When comparing human modification values within region, 6 (2% of total) wilderness candidate areas among all regions were outside the range of values observed within wilderness areas (Figure 5; Table 1). The distribution of human modification in wilderness candidate areas overlapped wilderness areas for nearly all regions. The wilderness candidate areas were slightly more modified than the NWPS units in R1, R3, and R5 (Figure 4). When comparing distance from roads within region, 24 (8% of total) wilderness candidate areas among all regions were outside the range of values observed within wilderness areas (Figure 5; Table 1). Based on the distribution of values, wilderness candidate areas tended to occur closer to roads compared to wilderness areas in nearly all regions.
When comparing light and noise pollution within region, 4 (1.3% of total) and 1 (<0.5%) of wilderness candidates among all regions, respectively, were outside the range of values observed within wilderness areas (Figure 5; Table 1). Based on the distribution of values of light pollution, wilderness candidate areas tended to be very similar to wilderness areas in nearly all regions (Figure 6). However, R2 wilderness candidate areas tended to experience less light pollution, whereas R8 wilderness candidate areas tended to experience more light pollution compared to wilderness in those regions (Figure 6). Based on the distribution of values of noise pollution, wilderness candidate areas tended to be very similar to wilderness areas in nearly all regions (Figure 7). Finally, average wilderness candidate areas were slightly higher in elevation (2,198 meters/7,211 ft. above sea level) than wilderness areas (1,413 meters/4,636 ft. asl) in the regions assessed here.
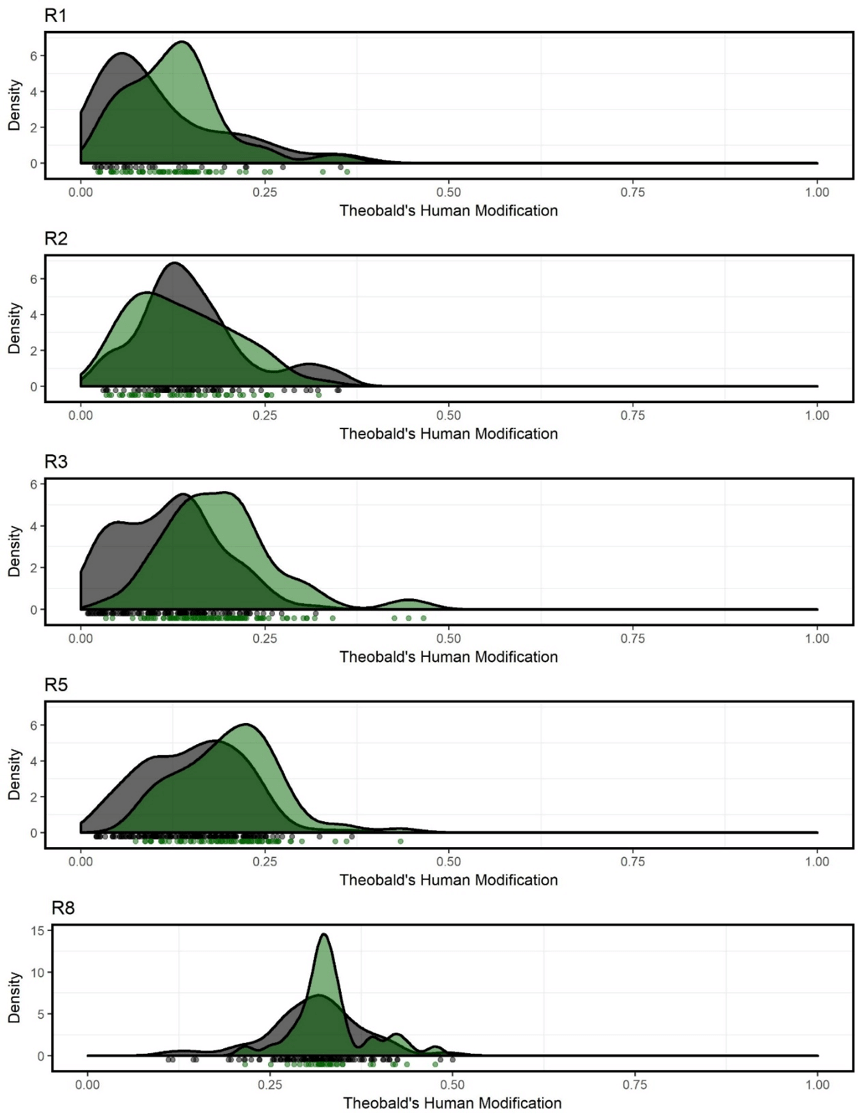
Figure 4 – Distribution of human modification by region within wilderness areas of the National Wilderness Preservation System (black) and wilderness candidate areas (green). Individual units are shown as a “rug plot” and used to count units outside the range of conditions within the NWPS.

Figure 5 –Distance from roads by region within wilderness areas of the National Wilderness Preservation System (black) and wilderness candidate areas (green). Individual units are shown as a “rug plot” and used to count units outside the range of conditions within the NWPS.
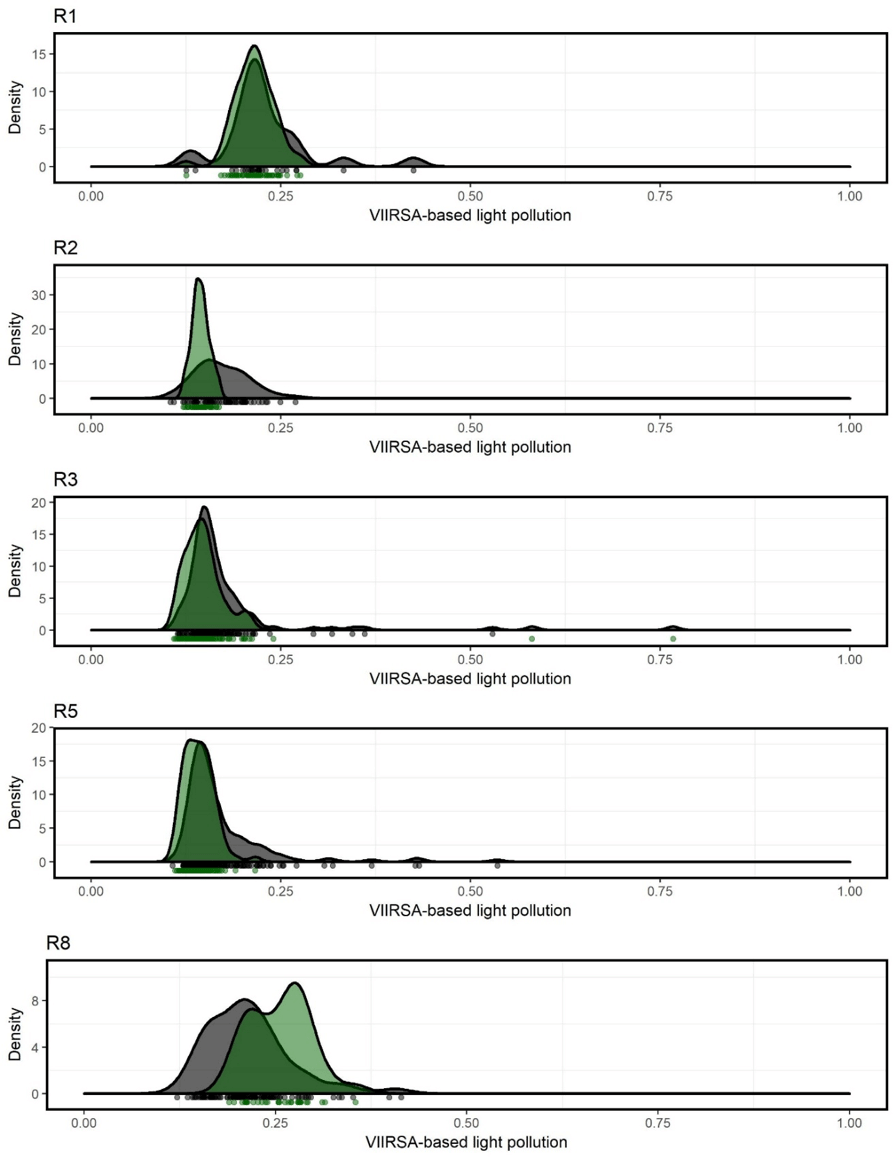
Figure 6 – Light pollution by region within wilderness areas of the National Wilderness Preservation System (black) and wilderness candidate areas (green). Individual units are shown as a “rug plot” and used to count units outside the range of conditions within the NWPS.

Figure 7 – Noise pollution by region within wilderness areas of the National Wilderness Preservation System (black) and wilderness candidate areas (green). Individual units are shown as a “rug plot” and used to count units outside the range of conditions within the NWPS.
Discussion
The wilderness character of wilderness candidates was almost always within the range of the existing NWPS. As citizens, stakeholders, and agency personnel evaluate candidates for future wilderness recommendations, this kind of national assessment of wilderness character should be an important step to ensure that candidates for wilderness are not held to a higher standard than lands within the existing NWPS. In fact, when pooled nationally, all wilderness candidate areas were within the range of values observed in the NWPS for each of the four metrics.
As a sample of areas, wilderness candidates did tend to have higher degree of human modification and lower distance to roads compared to wilderness areas in some regions (e.g., R1, R3, and R5) based on the distributions of values. It was hypothesized that this was because wilderness candidates were lower in elevation than wilderness areas. Wilderness and other protected areas typically occur higher in elevation (Aycrigg et al. 2013) with steeper slopes compared to unprotected lands, which has provided easier access for building roads and harvesting timber (Belote and Aplet 2014), or otherwise converting land to agricultural commercial, or residential land uses. Contrary to expectations, wilderness candidates were slightly higher in elevation compared to existing wilderness among and within the regions studied here. Despite this pattern, wilderness candidates do tend to be closer to human development and roads compared to existing wilderness.
Human modification and distance to roads both serve as measures of ecological integrity, degree of trammeledness, and outstanding opportunities for solitude, all of which represent wilderness character (Aplet et al. 2000; Theobald 2013; Landres et al. 2015). Despite the general patterns between wilderness candidates and wilderness areas in these qualities, no individual wilderness candidate could be considered more degraded than the range of the existing NWPS, and only a few could be considered more degraded than the range of values within the region. Wilderness candidates in the Southwestern Region (R3), however, had the greatest number of areas (23% of units) outside of the range of existing wilderness in that region with respect to distance from roads.
Light and noise pollution varied little between wilderness candidates and wilderness areas. In fact, in the Rocky Mountain Region (R2), wilderness candidates were characterized by darker night skies (less light pollution) than existing wilderness. Like distance to roads, the largest number of wilderness candidates that had more light pollution than the existing NWPS occurred in the Southwestern Region (R3), which may reflect proximity to urban or developed areas around Santa Fe and Los Alamos, New Mexico, and the surrounding national forests. Light and noise pollution impact ecological systems (Longcore and Rich 2004; Mennitt et al. 2014; Shannon et al. 2016) and can erode wilderness character (Tricker et al. 2012). Dark night skies with intact star-viewing opportunities and quiet outdoor experiences free from human-generated noises all represent important qualities of wilderness character and wildness (Aplet et al. 2000).
Taken together, these results suggest that in most cases, candidates for recommended wilderness represent lands that are as wild as the existing NWPS. As human populations increase and land use expands (Sohl et al. 2014), protecting the remaining wildlands is increasingly recognized as a key global, national, and local conservation priority (Venter et al. 2016; Watson et al. 2016; Belote et al. 2017). Wilderness areas and the NWPS represent a critical tool used to protect the remaining wildlands. The process by which agencies evaluate lands for potential wilderness recommendations is central to adding lands to this system. Although local evaluations will continue to be essential to assessing wilderness character (sensu Landres et al. 2015), national and global datasets increasingly allow for broad-scale analyses to evaluate lands across larger areas (Belote and Irwin 2017).
Ultimately, only the US Congress has the authority to legislatively designate new wilderness areas, which requires social and political processes. Agency recommendations to Congress, however, are an important aspect of designating new wilderness areas, as well as administratively maintaining the wilderness character of lands classified as recommended wilderness. Given the loss of wildlands globally (Watson et al. 2016) and nationally (Theobald et al. 2016), it is imperative that a national context is applied to decisions of how wilderness character is protected and managed on federal lands.
In conclusion, four nationally available mapped datasets representing measures of wilderness character were used to compare wilderness candidates with existing wilderness areas. This analysis was used to identify whether and how many wilderness candidates fell outside the range of the existing NWPS. Local evaluations could use the same framework to compare wilderness character of candidates with the existing system. If local assessments measure features that erode wilderness character (e.g., old roads, cabins, historical timber harvests) within lands serving as candidate for wilderness recommendations, managers could compare these qualities to nearby wilderness areas. Although wilderness areas represent some of the wildest and most intact lands in the country, they are not without human impacts (Cole and Yung 2010). Candidates for future wilderness should not be held to a higher standard than the existing NWPS.
Acknowledgments
Thanks to Matthew S. Dietz (MD) for comments and edits that substantially improved the manuscript.
R. TRAVIS BELOTE is a research ecologist with The Wilderness Society in Montana; email: travis_belote@tws.org
References
Aplet, G. H. 1999. On the nature of wildness: Exploring what wilderness really protects. Denver Law Review 76: 347–367.
Aplet, G., J. Thomson, and M. Wilbert. 2000. Indicators of wildness: Using attributes of the land to assess the context of wilderness. In Proceedings: Wilderness Science in a Time of Change – Volume 2: Wilderness withing context of largers systems, ed. S. F. McCool, D. N. Cole, W. T. Borrie, and J. O’Laughlin (pp. 89–98). Proceedings RMRS-P-15-VOL-2. Ogden, UT: US Department of Agriculture, Forest Service, Rocky Mountain Reseach Station.
Aycrigg, J. L., A. Davidson, L. K. Svancara, K. J. Gergely, A. McKerrow, and J. M. Scott. 2013. Representation of ecological systems within the protected areas network of the continental United States. PLoS ONE 8: e54689.
Aycrigg, J. L., C. Groves, J. A. Hilty, J. M. Scott, P. Beier, D. A. Boyce, D. Figg, H. Hamilton, G. Machlis, K. Muller, K. V. Rosenberg, R. M. Sauvajot, M. Shaffer, and R. Wentworth. 2016a. Completing the system: Opportunities and challenges for a national habitat conservation system. BioScience 66: 774–784.
Aycrigg, J. L., J. Tricker, R. T. Belote, M. S. Dietz, L. Duarte, and G. H. Aplet. 2015. The next 50 years: Opportunities for diversifying the ecological representation of the National Wilderness Preservation System within the contiguous United States. Journal of Forestry 114: 1–9.
Belote, R. T., and G. H. Aplet. 2014. Land protection and timber harvesting along productivity and diversity gradients in the Northern Rocky Mountains. Ecosphere 5(2): 1-19.
Belote, R. T., M. S. Dietz, C. N. Jenkins, P. S. McKinley, G. H. Irwin, T. J. Fullman, J. C. Leppi, and G. H. Aplet. 2017. Wild, connected, and diverse: Building a more resilient system of protected areas. Ecological Applications 27: 1050–1056.
Belote, R. T., M. S. Dietz, B. H. McRae, D. M. Theobald, M. L. McClure, G. H. Irwin, P. S. McKinley, J. A. Gage, and G. H. Aplet. 2016. Identifying corridors among large protected areas in the United States. PLoS ONE 11: e0154223.
Belote, R. T., and G. H. Irwin. 2017. Quantifying the national significance of local areas for regional conservation planning: North Carolina’s mountain treasures. Land 6: 35.
Burrows, R., J. Tricker, D. Abbe, P. Landres, J. Paynter, D. Schirokauer, and P. Hooge. 2016. Mapping Wilderness Character in Denali National Park and Preserve Final Report. Natural Resource Report NPS/DENA/NRR – 2016/1223. Fort Collins, CO.
Cole, D. N., and L. Yung. 2010. Beyond Naturalness: Rethinking Park and Wilderness Stewardship in an Era of Rapid Change. Washington, DC: Island Press.
Cordell, H. K., J. C. Bergstrom, and J. M. Bowker. 2005. The Multiple Values of Wilderness. State College, PA: Venture Publishing, Inc.
Dietz, M. S., R. T. Belote, G. H. Aplet, and J. L. Aycrigg. 2015. The world’s largest wilderness protection network after 50 years: An assessment of ecological system representation in the US National Wilderness Preservation System. Biological Conservation 184: 431–438.
Ibisch, P. L., M. T. Hoffman, S. Kreft, G. Pe’er, V. Kati, L. Biber-Freudenberger, D. A. Dellasala, M. M. Vale, P. R. Hobson, and N. Selva. 2016. A global map of roadless areas and their conservation status. Science 354: 1423–1427.
Jenkins, C. N., K. S. Van Houtan, S. L. Pimm, and J. O. Sexton. 2015. US protected lands mismatch biodiversity priorities. Proceedings of the National Academy of Sciences of the United States of America 112: 5081–5086.
Landres, P., C. Barns, S. Boutcher, T. Devine, P. Dratch, A. Lindholm, L. Merigliano, N. Roeper, E. Simpson, and R. Mountain. 2015. Keeping It Wild 2: Character Across the National Wilderness Preservation System. General Technical Report RMRS-GTR-340. U.S. Department of Agriculture, Forest Service, Rocky Mountain Research Station. Fort Collins, CO:
Longcore, T. and C. Rich. 2004. Ecological light pollution. Frontiers in Ecology and the Environment. 21: 191-198. Mennitt, D., K. Sherrill, and K. Fristrup. 2014. A geospatial model of ambient sound pressure levels in the contiguous United States. The Journal of the Acoustical Society of America 135: 2746–2764.
Monahan, W. B., J. E. Gross, L. K. Svancara, and T. Philippi. 2012. A Guide to Interpreting NPScape Data and Analyses. Natural Resource Technical Report NPS/NRSS/NRTR – 2012/578. National Park Service. Fort Collins, Colorado.
National Park Service. 2013. NPScape Standard Operating Procedure: Roads Measure – Road Density, Distance from Roads, and Area without Roads. Version 2015-04-23. National Park Service. Natural Resource Stewardship and Science. Fort Collins, Colorado.
Nelson, L., M. Kinseth, and T. Flowe. 2015. Explanatory Variable Generation for Geospatial Sound Modeling Standard Operating Procedure. Natural Resource Report NPS/NRSS/NRR – 2015/936. National Park Service. Fort Collins, Colorado.
Noss, R. F., W. J. Platt, B. A. Sorrie, A. S. Weakley, D. B. Means, J. Costanza, and R. K. Peet. 2015. How global biodiversity hotspots may go unrecognized: Lessons from the North American Coastal Plain. Diversity and Distributions 21: 236–244.
Pouzols, F. M., T. Toivonen, E. Di Minin, A. S. Kukkala, P. Kullberg, J. Kuusterä, J. Lehtomäki, H. Tenkanen, P. H. Verburg, and A. Moilanen. 2014. Global protected area expansion is compromised by projected land-use and parochialism. Nature 516: 383–386.
Pressey, R. L., and M. C. Bottrill. 2009. Approaches to landscape- and seascape-scale conservation planning: Convergence, contrasts and challenges. Oryx 43: 464.
Shannon, G., M. F. McKenna, L. M. Angeloni, K. R. Crooks, K. M. Fristrup, E. Brown, K. A. Warner, M. D. Nelson, C. White, J. Briggs, S. McFarland, and G. Wittemyer. 2016. A synthesis of two decades of research documenting the effects of noise on wildlife. Biological Reviews 91: 982–1005.
Sohl, T. L., K. L. Sayler, M. A. Bouchard, R. R. Reker, A. M. Friesz, S. L. Bennett, B. M. Sleeter, R. R. Sleeter, T. Wilson, C. Soulard, M. Knuppe, and T. Van Hofwegen. 2014. Spatially explicit modeling of 1992–2100 land cover and forest stand age for the conterminous United States. Ecological Applications 24: 1015–1036.
Theobald, D. M. 2013. A general model to quantify ecological integrity for landscape assessments and US application. Landscape Ecology 28: 1859–1874.
Theobald, D. M., L. J. Zachmann, B. G. Dickson, M. E. Gray, C. M. Albano, V. Landau, and D. Harrison-Atlas. 2016. The Disappearing West: Description of the Approach, Data, and Analytical Methods Used to Estimate Natural Land Loss in the Western US. Truckee, CA: Conservation Science Partners.
Tricker, J., P. Landres, J. Chenoweth, R. Hoffman, and R. Scott. 2013. Mapping Wilderness Character in Olympic National Park Final Report. Missoula, MT.
Tricker, J., P. Landres, S. Dingman, C. Callagan, J. Stark, L. Bonstead, K. Fuhrmann, and S. Carver. 2012. Mapping Wilderness Character in Death Valley National Park. Natural Resource Report NPS/DEVA/NRR – 2012/503. Fort Collins, CO: Page National Resource Stewardship and Science.
Tricker, J., B. Macewen, R. O. Neil, and P. Landres. 2016. Mapping Threats to Wilderness Character in the Saguaro National Park Wilderness. Missoula, MT.
Tricker, J., A. Schwaller, T. Hanson, E. Mejicano, and P. Landres. 2017. Mapping Wilderness Character in the Boundary Waters Canoe Area Wilderness. Gen. Tech. Rpt. RMRS-357. Fort Collins, CO.
US Census Bureau. 2015. TIGER / Line Shapefiles Technical Documentation.
USDA. 2012. National Forest System Land Management Planning Rule. Page 36 CFR Part 219 Federal Register.
Venter, O., E. W. Sanderson, A. Magrach, J. R. Allan, J. Beher, K. R. Jones, H. P. Possingham, W. F. Laurance, P. Wood, B. M. Fekete, M. A. Levy, and J. E. M. Watson. 2016. Sixteen years of change in the global terrestrial human footprint and implications for biodiversity conservation. Nature Communications 7: 1–11.
Watson, J. E. M., D. F. Shanahan, M. Di Marco, J. Allan, W. F. Laurance, E. W. Sanderson, B. Mackey, and O. Venter. 2016. Catastrophic declines in wilderness areas undermine global environment targets. Current Biology 26: 1–6.
Read Next
WILD11: Why China, and Why Now
The 11th World Wilderness Congress (WWC), or WILD11, will convene in China in late 2019. Our China partners have promised exact venue and date for 2019 in September of this year.
Paradigms Lost: A Rumination on the Pursuit of Wildness
Recently, two reissued books from the early 1900s caught my attention. The books are That Summer on the Nahanni 1928: The Journals of Fenley Hunter and Sleeping Island: A Journey to the Edge of the Barrens, by P. G. Downes.
Understanding and Mitigating Wilderness Therapy Impacts: The Grand Staircase-Escalante National Monument Case Study
Studies demonstrate that wilderness therapy programs can be beneficial for participants; however, little research has explored the ecological impacts of these programs.