Long-Term Comparative Analysis, Challenges, and Opportunities
Stewardship
April 2016 | Volume 22, Number 1
by RYAN L. SHARP, JUSTIN D. KURTZ, and JAMES N. MAPLES
PEER REVIEWED
Abstract: Campsite impacts can take away from the unique qualities that wilderness provides, and monitoring these impacts is an important component of protected area management. In this study, we collected data on campsites and rock-shelters in the Clifty Wilderness Area in the Daniel Boone National Forest. Impact parameters included number of sites, site size, tree damage, and overall condition. These parameters were then compared with 2007 data collected by Daniel Boone National Forest staff. Compared to 2007, an additional 96 campsites were found, but 64 fewer rock-shelters. Overall site impacts (such as average total area per site and condition class) indicated a mix of improvements at some sites and increased impact at others. This study further underscores the need for long-term monitoring of recreational impacts in wilderness while being mindful of the difficulty in measuring impacts across time.
Introduction
Human activity can negatively impact wilderness areas. Camping in particular can have marked impact on protected areas (Cole 2013). Campsite impact occurs both locally and collectively across wilderness areas (Cole, Foti, and Brown 2008). Contributing factors to campsite impact include human factors (e.g., frequency of use and user behaviors), ecological durability, management action, and spatial factors such as distribution of parking areas and trail networks (Cole 2004). Wilderness managers are concerned with these impacts as they balance the dichotomy of preserving the wilderness as a finite resource while allowing legally mandated opportunities such as the pursuit of solitude and unconfined recreation (US Public Law 88-577). Fortunately, management frameworks provide land managers guidance for managing impacts and inform management actions that balance preservation and use.
One such framework utilized by the USDA Forest Service is Limits of Acceptable Change (LAC). According to Stankey, Cole, Lucas, Peterson, and Frissell:
The LAC process consists of four major components: (1) the specification of acceptable and achievable resource and social conditions, defined by a series of measurable parameters; (2) an analysis of the relationship between existing conditions and those judged acceptable; (3) identification of management actions necessary to achieve these conditions; and (4) a program of monitoring and evaluation of management effectiveness. These four components are broken down into nine steps to facilitate application. (1985)
In 2007, the Daniel Boone National Forest (DBNF) initiated components one and two of the LAC planning process (US Forest Service n.d.). This included using the Global Positioning System (GPS) to measure campsite and rock-shelter locations and conditions within the Clifty Wilderness Area (CWA) of the DBNF. After this initial data collection, DBNF managers began to implement component three of the LAC process, specifically identifying actions designed to reduce the proliferation of user-created campsites and overuse of sensitive rock-shelters (e.g., education at trailheads, site closures, trail closures related to sites).
In the summer of 2014, we conducted a study of ecological conditions related to recreational camping in the CWA to address component four of the LAC, monitoring and evaluating management effectiveness. This study replicated the 2007 study completed by DBNF staff. Replicating studies that monitor long-term visitor impacts of wilderness are essential to the social and environmental well-being of the areas (Loomis 2000), but are rarely found in the literature. The primary purpose of this article is to examine the differences between the two data collections periods in relationship to wilderness management. Specifically, it addresses the challenges associated with replicating data collection and the barriers to reliable and consistent monitoring of wilderness resources.
Description of the Study Area
The CWA is located in the DBNF within the eastern half of Kentucky, United States. Designated in 1985, it encompasses 5,006 ha (12,370 acres) and is managed by the US Forest Service (Wilderness.net, n.d.). The CWA is composed of a mixed mesosophytic forest characterized by hemlocks, hardwoods, and rhododendron thickets. The area is also known for its rugged, steep cliffs, sandstone arches, and rock-shelters. Popular outdoor recreation activities include hiking, backpacking, camping, and rock climbing.
Due to its close proximity to large urban centers, the DBNF’s forest and wilderness areas receive a high level of use from visitors. The city of Lexington, Kentucky (population 310,000), is approximately an hour away (111 km/69 miles), and the cities of Louisville, Kentucky (population 610,000), and Cincinnati, Ohio (population 300,000), are both approximately two hours away (233 km/145 miles). These short distances make CWA very attractive for both day use and week-end camping. Additionally, the CWA is easily accessible. Its western border is the main road that travels through the DBNF, providing visitors easy access to recreation sites from their parked cars.
Methods
We collected data for both campsites (Figure 1) and rock-shelters (defined here as cave-like recesses of sufficient size to allow camping) (Figure 2) with a Trimble GPS receiver during the months of July and August 2014. Campsites and rock-shelters were located by walking all of the formal and informal trails in the study area. This was made possible because of the relatively clear boundaries of the wilderness area (several campsites were removed from the analysis because it was revealed on examination in GIS that they were outside of the boundaries). Rock-shelters were defined as areas of at least 6 feet (1.83 m) in height and had sufficient overhang as to not receive rain on a regular basis. Campsites were identified by any level of disturbance to the surrounding area (e.g., trampling, compaction, fire rings, trash, etc.). We replicated data collection protocols used in the 2007 study, using the original instructions developed by Marion (1991) and modified in collaboration with DBNF managers (Campsite Census Manual 2005). Measurements taken included presence of tree damage (e.g., number of tree stumps in the area impacted and tree/shrub damage related to recreational use [not the result of natural forces] ranging from none to severe), and presence of graffiti based on a 0–5 scale (0 = no graffiti present to 5 = more than 50 square feet [4.65 sq. m] are covered). Graffiti was defined as being carved, painted, chalked, or charcoal. The length and width of the impact area was also measured using the geometric figure method (i.e., rectangle), which provides a rapid and accurate measurement when paired with good judgment (Marion 1991). Campsites were also individually rated for condition class from 0–5 (0 = campsite barely distinguishable and 5 = soil erosion is obvious, as indicated by exposed tree roots and rocks and/or gullying). Data were loaded postcollection into ArcGIS 10.2 and plotted onto a CWA layer within the program.
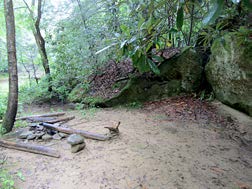
Figure 1 – Example of a campsite in the Clifty Wilderness. Photo by Justin Kurtz.
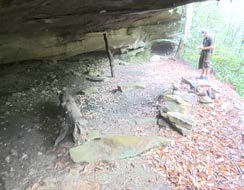
Figure 2 – Example of a rock-shelter in the Clifty Wilderness. Photo by
Ryan Sharp.
Basic descriptive statistics and frequencies were utilized to explore the differences between the two data collection periods. The purpose of this analysis was not meant to determine a statistically significant difference, as this was of less value to the wilderness area managers. Instead, the intent of the analysis was to document results for comparison that could provide discussion points and highlight the challenges and merits associated with the replication of monitoring protocols.
Limitations
The researchers made every effort to duplicate the protocols from the 2007 study and document every campsite and rock-shelter in the study area. However, the 2007 data collection was part of the forest’s LAC planning effort that included funding for several employees and researchers for data collection. The 2014 follow-up study did not have the same staffing or financial support. During an initial pilot of the 2014 data collection, it became apparent, within the financial and time constraints for this research, that attempting to relocate every rock-shelter and campsite from the 2007 data collection period would not be feasible, particularly with need to also document new campsites. This challenge was mainly due to the poor GPS reception in many parts of the CWA and the intense clustering of sites in many popular areas. Additionally, many campsites and social trails leading to previously inventoried campsites may have recovered to the point of being undetectable by the researchers. Finally, although the 2007 and 2014 data collection events used identical protocols, the subjective nature of many of the measurement parameters could have influenced the results. For example, many rock-shelters that were inventoried in 2007 were not in 2014 because on inspection it was determined that they did not meet the 6 foot (1.83 m) height minimum of the 2007 protocol.
Results
Campsite Analysis
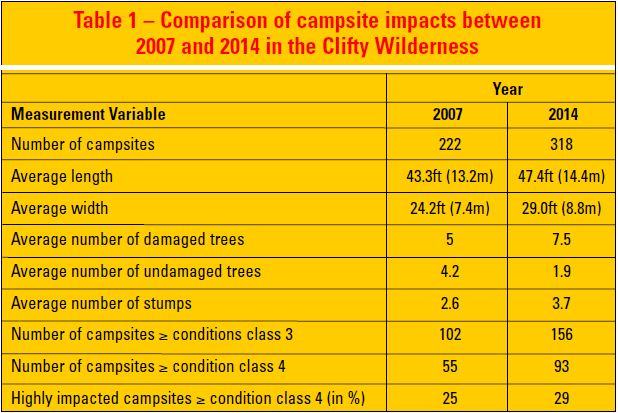
Table 1 includes comparative descriptive statistics for campsites measured in 2007 and 2014. A total of 318 campsites were located and measured in 2014, compared to 222 campsites in 2007. The average size for a campsite in 2014 was 1374.6 ft2 (419.0 m2), compared to 1047.8 ft2 (319.3 m2) in 2007. This marks a 31% increase in average size of impact area for campsites within the CWA since 2007.
Campsites in 2014 also indicate an increase in human impact, as measured by condition class. The mean for condition class for 2014 was 2.23 out of 5. This was a slight increase in comparison to the mean of 2.21 in 2007. This change may be in the difference in percentage of highly impacted campsites (designated by a condition class of 4 or higher) between the two studies. Highly impacted campsites made up 25% of the total campsites in 2007. In 2014, 29% of campsites were rated at a condition class of 4 or higher. This relationship remains true for a condition class of 3 or higher with 46% in 2007 and 49% in 2014. Other measurements taken also revealed a trend of increased impact. In 2007, camp-sites had an average of five damaged trees. In 2014, the number of average damaged trees increased to 7.5. The number of tree stumps also increased by 42% from 2.6 stumps to 3.7 tree stumps per campsite.
Rock-Shelter Analysis
Table 2 includes comparative descriptive statistics for rock-shelters measured in 2007 and 2014. Researchers discovered only 70 rock-shelters in 2014, which is notably different from the 134 located in 2007. It is conjecture, but social trails leading to the many of the rock-shelters discovered in 2007 may now be unnoticeable in 2014 due to lack of use, leading to areas with groups of rock-shelters not being explored. As previously noted, the 6 foot (1.83 m) height minimum to define a rock-shelter was also more strictly observed in 2014, potentially leading to a decrease in numbers. Other measures indicate slight changes between 2007 and 2014. The average number of damaged trees in the area immediately surrounding a rock-shelter was 0.4. In 2014, that number increased to 0.6 damaged trees. The average number of stumps and the average number of non-damaged trees varied slightly at 0.2 and 0.5 respectively from 2007 to 2014. Graffiti of any kind was present in 20% of the rock-shelters found in 2007. In 2014, 15% of rock-shelters located had graffiti present.

GIS Spatial Analysis
We used GIS software ArcMap 10.2 to further compare findings from both studies. This software was especially helpful in identifying and comparing impact to specific locales within the CWA. The results were a mix of improvement and decline. For example, one popular hiking area revealed improvement for campsite impacts based on condition class even as the mean condition grew worse. In 2007, six campsites were located in this area, five of which were classified as a condition class 3 or greater. In this same area in 2014 only three campsites were discovered and none had a higher condition class greater than 1. Conversely, another area (upper Osborne Trail) with limited camping impact in 2007 saw a marked increase in 2014 (see Figure 3). Researchers in 2007 found 24 campsites along this stretch of official Forest Service trail. In 2014, researchers located 74 campsites in this same area along this trail. It is noteworthy that the majority of the campsites in this area were classified as a condition class less than 3 (n = 51) in 2014. This may be an indicator of the new creation or light use of these campsites. It is also possible that these campsites existed in 2007 but were overlooked by researchers because of their minimal impact.
We also found interesting possible trends for the popular informal trail in the area. In 2007, there were 21 campsites in this area with a condition class of 4 or greater. Researchers discovered 19 campsites classified as a condition class of 4 or greater in 2014. However, examination of the GIS data revealed that campsites along this trail could be divided into two distinct areas: lower and upper. In 2007, the highest concentration (n = 15) of highly impacted sites fell within the lower section of the trail. However, in 2014 only 5 sites remained highly impacted in this lower section. Interestingly, the reverse is true for the upper portion of the trail. In 2007, only 6 highly impacted sites appear in the upper portion of this social trail, but 14 highly impacted campsites are present in 2014. This could possibly be the result of visitors seeking out a more wilderness-like experience by getting farther away from the road.
Conclusions and Implications for Management
Wilderness and the benefits derived from it may become more and more important as recreationist begin to further realize what a limited and sensitive resource it really is (Watson, Cordell, Manning, and Martin 2015). This realization may lead to more people wanting to experience it for themselves, which can lead to issues of crowding and overuse. The management of wilderness areas such as CWA will always be a challenge because of its proximity to large numbers of people. Therefore, a strong case can be made for increased monitoring efforts to help reduce the potential negative impacts of activities such as camping and identify areas of concern, although this is not easily accomplished.
This comparative study has high-lighted the difficulty in doing such an analysis. Some basic conclusions can be made, such as the proliferation of campsites in some areas compared to 2007 (see Figure 3), and overall impacts appear to be relatively stable (based on 0–5 impact scale focused on condition class). However, the increase in the number of campsites and the fewer number of rock-shelters inventoried may be due to visitor use or the method of data collection. Also, the DBNF managers have done a considerable amount of work to close campsites/rock-shelters and rehabilitate others in hopes of reducing the overall impacts of use. However, we inventoried almost 100 more camp-sites in 2014, thus showing that use has possibly increased, use has shifted, or visitors are seeking out more pristine camping sites. Camping near water remains popular, but the proliferation of campsites in certain areas should be reason for concern.
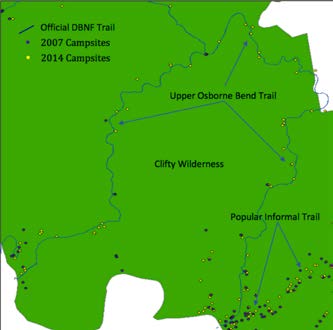
Figure 3 – Trail campsites comparison between 2007 and 2014.
Although past studies have been able to identify and relocate sites from one period of time to another (see Reid and Marion 2004 and Twardock, Monz, Smith, and Colt 2010), these are rare and often conducted by experts in recreation ecology. This means that those with greater expertise and training are often the only ones able to conduct repeated measures of campsite impacts (especially on a large scale such as this study). Although there has been a call for more in-depth and sophisticated methods of understanding recreational impacts such as camping on natural resources (Monz, Cole, Leung, and Marion 2010), maybe simpler is the better road forward. This is not to say that the work done by many researchers to understand the complexities of recreational impacts in wilderness areas is not worthwhile, or should be discontinued. Rather, perhaps there is a way to provide rapid assessments that can be conducted with little technical equipment and little technical expertise that will allow wilderness managers to monitor impacts over time. Would it be better to have some idea of impacts to campsites over time through a rapid assessment, or no data at all? This is the debate we wish to raise and further with this study.
We attempted to replicate a study done seven years previous using the same protocol, not a substantial amount of time given research time lines. Due to very limited funding and time, we were unable to individually identify and catalog the close to 350 campsites and rock-shelters identified in the first round of data collection. This is not an uncommon barrier to conducting repeated measures over time. Most wilderness areas are already working on shoestring budgets and rarely have the funding to collect baseline data, let alone long-term monitoring. The amount of effort needed to do the research is also a significant barrier. Two researchers spent two months collecting the data in 2014 to catalog 318 campsites and 70 rock-shelters in a relatively small wilderness – 12,371 acres (5,006 ha). This amount of time is hard to come by for wilderness managers. Does the data collected in this study help wilderness managers make decisions? Does the subjective nature of the methods yield confusing and possibly counterproductive data? Were there really more than 90 campsites created from 2007 to 2014, or was the perception of what a campsite looked like different between those who were doing the inventories? These are all valid questions that need to be taken into consideration. However, this information is still useful in identifying impacts and documenting impact trends in a wilderness area.
Wilderness managers will always be working to maintain the integrity of natural resources through different techniques. Monitoring impacts over time, even in a rapid assessment format, and taking into consideration the limitations discussed previously, can yield insight into how effective certain management actions are. The results of this study show that there are more campsites seven years later, which could mean an increase in use, or perhaps a change in camper behavior. There were more damaged trees and a higher number of stumps, possibly pointing to a more intense level of use. There was an increase in the number of highly impacted sites. These descriptive trends may point to the need for more intensive management, or that certain attempted management actions may need to be reworked, better understood, or abandoned altogether. Consistent monitoring of conditions related to recreational use is critical to maintaining wilderness character, and is worthwhile even in the face of methodological difficulty. Managers may consider choosing several test sites within the CWA and conducting repeated measures testing in conjunction with specific management actions (e.g., closing campsites) to see if a rapid assessment can provide useful information for maintaining wilderness qualities. There is not a substitute for in-depth, one-to-one repeated measures of use impacts in wilderness areas. However, if a more rapid assessment yields useful information for managers, this may be a more cost-effective and time-efficient way to monitor impacts over time.
Acknowledgments
This study was made possible through funding provided by the US Forest Service. Equipment for data collection and field staff were provided by the Division of Natural Areas and the Recreation and Park Administration Department at Eastern Kentucky University. Special thanks to Tim Eling for helping provide the data and protocol from the 2007 study.
RYAN L. SHARP is an assistant professor in the Horticulture, Forestry and Recreation Resources Department at Kansas State University; email: ryansharp@ksu.edu.
JUSTIN D. KURTZ is an adjunct professor in the Recreation and Park Adminis-tration Department at Eastern Kentucky University; email: justin_kurtz4@mymail. eku.edu.
JAMES N. MAPLES is an assistant professor in the Anthropology/Sociology/Social Work Department at Eastern Kentucky University; email: james. maples@eku.edu.
View more content from this issue >
References
Campsite Census Manual. 2005. Daniel Boone National Forest. Version 3/10/05.
Cole, D. N. 2013. Long-term effectiveness of restoration treatments on closed wilderness campsites. Environmental Management 51: 642–650.
———. 2004. Impacts of hiking and camping on soils and vegetation: A review. Environmental Impacts of Ecotourism 41: 60.
Cole, D. N., P. Foti, and M. Brown. 2008. Twenty years of change on campsites in the backcountry of Grand Canyon National Park. Environmental Management 41(6): 959–970.
Loomis, J. B. 2000. Counting on recreation use data: A call for long-term monitoring. Journal of Leisure Research 32(1): 93–96.
Marion, J. L. 1991. Developing a Natural Resource Inventory and Monitoring Program for Visitor Impacts on Recreation Sites: A Procedural Manual. Natural Resources Report NPS/NRVT/ NRR-91/06. Denver, CO: USDI National Park Service.
Monz, C. A., D. N. Cole, Y. Leung, and J. L. Marion. 2010. Sustaining visitor use in protected areas: Future opportunities in recreation ecology research based on the USA experience. Environmental Management 45: 551–562.
Reid, S. E., and J. L. Marion. 2004. Effectiveness of a confinement strategy for reducing campsite impacts in Shenandoah National Park. Environmental Conservation 31(4): 274–282.
Stankey, G. H., D. N. Cole, R. C. Lucas, M. E. Peterson, and S. S. Frissell. 1985. The Limits of Acceptable Change (LAC) System for Wilderness Planning. General Technical Report INT 176. Ogden, UT: USDA Forest Service, Intermountain Forest and Range Experiment Station.
Twardock, P., C. Monz, M. Smith, and S. Colt. 2010. Long-term changes in resource conditions on backcountry campsites in Prince William Sound, Alaska, USA. Northwest Science 84(3): 223–232.
US Forest Service. (N.d.). Limits of acceptable change. Retrieved from http://www.fs.usda.gov/detail/dbnf/home/?cid=stelprdb5346360.
S Public Law 88-577. The Wilderness Act of September 3, 1964. 78 Stat. 890.
Watson, A. E., H. K. Cordell, R. Manning, and S. Martin. 2015. The evolution of wilderness social science and future research to protect experience, resources, and societal benefits. Journal of Forestry. Retrieved from http://www.ingentaconnect.com/content/saf/jof/pre-prints/content-jof14145.
Wilderness.net. (N.d.). Clifty Wilderness fact sheet. Retrieved from http://www.wilderness.net/printFactSheet. cfm?WID=127.