Upper Twin Lakes. Lake Clark National Park.
Social Media Data in Remote and Low-Use Backcountry Areas: Applications and Limitations
Science + Research
April 2020 | Volume 26, Number 1
PEER REVIEWED
ABSTRACT This article evaluates data from user-generated content related to two national parks in Alaska. One season of Twitter and Flickr posts was collected, coded for content, and mapped if geographic data was available. The dataset was assessed for quality and compared with information reported by commercial operators. Of 4,008 social media users who referenced the parks, 223 were on-site visitors and 144 visited the backcountry. Results suggested that social media overrepresented bear-viewing behaviors, and that spatial data was limited. Using social media data to understand low-use, remote backcountry settings can be useful, but more research is needed to understand limitations related to setting, media platform, and spatiotemporal scales.
Information about visitor use in parks and protected areas is an essential component of effective management (Cessford and Muhar 2003). Data about recreation users has long been recognized as important for several reasons, including the ability to manage budgets, personnel, protect resources, and to provide visitors with enjoyable experiences (Manning 2010). Useful visitor information for managers includes data on visitor counts, type of visitor use (e.g., primary activity), timing of use (e.g., season), indicators and thresholds of quality, and rule compliance (Manning 2010; Marion, 2016; Cahill et al. 2018). Previous studies also indicate that it is beneficial for managers to understand characteristics of users, including activity type (Manning 2010). Activity type can influence visitors’ temporal and spatial distributions, impacts on natural resources, or user conflicts (Jacob and Schreyer 1980; Kyle, Graefe, Manning, and Bacon 2003).
Commonly used methods for collecting this data include infrared sensors and cameras, on-site observations, permit systems, and questionnaires (Cessford and Muhar 2003; Manning 2010). These methods can be costly, in both monetary and human capital resources (Fay et al. 2010). Questionnaires are commonly used to understand park visitors, including their demographics, behaviors, normative standards for natural or social conditions, values, and satisfaction (Vaske 2008). However, surveys are expensive to conduct, especially in remote areas, and while on-site survey response rates for specific stakeholder groups remain relatively high, survey response rates are declining broadly (Vaske 2008), so there is a need to better understand alternative or supplemental methods to collect data on visitor use.
In the United States, remote areas comprise both backcountry and federally designated wilderness. Federally designated wilderness is a legal classification in the United States that refers to a high level of protection of biophysical and social resources (Hendee and Dawson 2002). The US National Park Service (NPS) uses the term “backcountry” to refer generically to “primitive” or “undeveloped” areas (NPS 1991). While all designated wilderness is considered backcountry, not all backcountry is designated wilderness. Visitor use monitoring in backcountry and wilderness is uniquely challenging, especially in terms of cost (Hollenhorst et al. 1992). For example, without a concentrated area of visitor use, a location through which all or most visitors pass, or a permit system, survey distribution becomes extremely expensive. Fay et al. (2010) write that managers describe survey distribution in dispersed backcountry settings that receive little use as “cost-prohibitive,” stating that combining multiple data sources can significantly improve the sample.
In light of these challenges, researchers have begun investigating methods for utilizing user-generated online content, such as social media posts, to assess visitor use in parks and protected areas (e.g., Sessions et al. 2016; Fisher et al. 2018; Levin, Lechner, and Brown 2017; Mancini et al. 2018; Hausman et al. 2018; Hamstead et al. 2018; Tenkanen et al. 2017).
Social Media Studies
Social scientists began exploring online data sources as early as 1997, with the emergence of web blogs (Khang et al. 2012). By 2007, geographers were utilizing web data to understand populations on a landscape scale and coined the term “volunteered geographic information” (VGI) (Goodchild 2007). Studies using VGI have utilized a range of internet sources (e.g., Twitter, OpenStreetMap, Strava fitness mobile app) to address a variety of social and natural research topics, fitness activities, urban planning, natural disaster relief, and more (Arapostathis et al. 2018; Haworth and Bruce 2015; Griffin and Jiao 2015). Recently, researchers have begun applying these concepts to visitor use in parks and protected areas, albeit less commonly in backcountry or wilderness settings. NPS planners have considered volunteered geographic information, specifically mobile fitness tracker data, when identifying visitor capacity (NPS 2018a).
An early application of social media data for visitor use research by Wood and colleagues (2013) evaluated Flickr data from tourism sites globally and determined that it could serve as a proxy for visitation. Several studies have since used social media data to identify geographic hotspots for cultural ecosystem services by using shared photos to map areas of value and identify salient characteristics of these areas across landscape scales (e.g., Pastur et al. 2016; Richards and Friess 2015; van Zanten et al. 2016), and on finer scales (e.g., Tenerelli et al. 2016). Others have used photos and Twitter to understand how travel patterns (e.g., Chua, et al. 2016; Heikinheimo et al. 2017). However, few studies have utilized social media data to analyze recreation use by activity type to understand visitor behaviors, as opposed to their preferences or locations.
Wood and colleagues (2013) describe possible limitations to using social media data in the context of parks and protected areas, including possible biases because certain activities are more photogenic or easy to photograph, due to perceived value affecting posting behavior, or because local visitors may be less inclined to share their experience online. Users may be tailoring shared content on social media to elicit a positive response from social media followers, which may influence the data (Boley et al. 2018). Biases and limitations to user-generated data have indeed been demonstrated. Tweets and other VGI data sources have been shown to have an urban bias (Hecht and Stephens 2014). Additionally, social media is not used equally by all demographics. In Kruger National Park, Hausmann et al. (2018) asked visitors about their social media use. They found that older and higher-income tourists were less likely to use social media, and that Flickr photos showed more biodiversity relative to Instagram, which showed more photos of people.
Previous studies were primarily conducted in urban-proximate areas, relatively densely used areas, or conservation areas with cellular signal (e.g., Heikinhemo et al. 2017; Hamstead et al. 2018; Fisher et al. 2018; Hausmann et al. 2018), while fewer studies were conducted in more remote or sparsely used areas or on a fine spatiotemporal scale. Tenkanen et al. (2017) compared social media data and official park visitation statistics in national parks in Finland and South Africa and showed that while social media was a good proxy for visitation in heavily populated parks, it may underestimate popularity of less-visited parks. Mancini et al. (2018) analyzed spatial data from the relatively low-visitation Cairngorms National Park in Scotland but used six years of data. Similarly, Walden-Schreiner and colleagues (2018b) evaluated geotagged Flickr photos in low-use protected areas and on a site-specific scale but included seven years of data. This manuscript assesses the usefulness of these data by applying similar methods in a sparsely visited backcountry and wilderness setting, and in both fine spatial and temporal scales.
Specifically, this study aims to:
- Understand to what degree social media users who share content related to the parks are in-person visitors
- Examine whether social media data can be used to understand the recreation activity type of on-site visitors on a site- and season-specific scale
- Examine the limitations of using social media data to understand visitors, specifically whether it overrepresents certain populations of users
Methods
Study Area
Katmai and Lake Clark National Parks and Preserves (KATM and LACL), located in southwest Alaska, are two of the least-visited US National Parks. The two parks have a combined 8 million acres (33,000 km2), nearly three-quarters of which is federally designated Wilderness (NPS 2016). All of LACL can be considered backcountry, while in KATM, the only area that is not considered backcountry is Brooks Camp, which is a relatively small area renowned for its brown bear viewing opportunities, and contains a visitor center, picnic area, and lodge. Brooks Camp is also well-known for its “bear cams,” which livestream brown bears throughout their active season (Explore n.d.). Neither park is accessible by road and both are typically accessed by small fixed-wing aircrafts or boats. There is little to no cellular connectivity in the park, although some visitors who stay in backcountry lodges have access to WiFi. While the commercial use authorized (CUA) pilots and guides report data to the parks, there is currently no reservation system that the parks utilize to monitor backcountry use.
The National Park Service Southwest Alaska Inventory and Monitoring Network (SWAN) compiles data reported by CUAs for each park (SWAN 2018a, 2018b). CUA data can be useful for counting visitors and have been used in similar remote parks, such as Kenai Fjords National Park and Gates of the Arctic National Park and Preserve (Fay et al., 2010). According to these reports, visitor use days reported by CUAs to KATM fluctuated between 25,000 and 30,000 between 2008 and 2017, while the number of visitor use days reported to LACL grew from 4,000 days to more than 15,300 days during the same time period. The NPS, whose counting methods count visitors rather than use days and includes non-CUA visitors, reports 37,818 and 22,755 visitors in 2017 in KATM and LACL, respectively.
The KATM report shows that the area with the highest number of visitor use days is Brooks Camp, the only front country area in both parks. It also appears that the sum of visitor use days in the remaining areas in KATM approximates the number at Brooks Camp alone. Furthermore, because all of LACL is considered backcountry, when these parks are combined there are more backcountry visitor use days than front country days (SWAN 2018a, 2018b).
Visitor activities are also reported by SWAN (2018a, 2018b). For both parks, bear viewing and sport fishing were the most frequently reported activities by a significant margin. In Lake Clark, photography was also a very highly reported activity, although not as commonly reported as bear viewing or fishing.
Activities are not mutually exclusive. At both parks, bear viewing use has been increasing in recent years relative to sport fishing. In 2016, the most recent year of data reported, there were approximately 42% more bear viewing days than sport fishing days in LACL (~3,600 fishing; 5,100 bear viewing), while there were similar numbers of each reported at KATM.
Data Collection
Researchers commonly use Twitter, Flickr, and Instagram as social media data sources for a variety of reasons, including their popularity and ease of data access (Tenkanen et al. 2017). However, this study evaluated only Twitter and Flickr since Instagram limited their data access in 2018. Data from both platforms was collected using their respective application programming interfaces (API). Generally, an API provides a way for two platforms to communicate with one another; in this case, it allows a coder to access and specify information from the social media platform. Twitter data was collected through the Twitter API in real time between June 15, 2018, and October 24, 2018, which approximates the peak visitation season at both parks (SWAN 2018a, 2018b). Additionally, tweets continued to download for two months after peak season, until October 24, 2018, to account for a possible lag time between visiting and posting. All tweets were saved into a database in real time. The database includes tweet text, photo URLs, profile information, and geographic data.
Flickr data posted during the same time frame was collected through the Flickr API using Python. This script created a database with the unique photo identifier, user name, any caption text, tags, date and time the photo was taken, date and time it was posted, and geographic information if available. The Flickr API allows researchers to collect photos and corresponding metadata by specifying a time frame and bounding box, which is a geographic area defined by two latitudes and two longitudes (Hausmann et al 2018). Additionally, photos were queried by manually inputted tags (e.g., Mancini 2018).
Due to concerns that low overall visitation would result in too few posts for meaningful analysis, the initial data collection was executed with very liberal search queries in order to capture as many posts as possible. To evaluate data collection methods in remote areas with little-to-no cellular connectivity, this wide query “net” was combined with detailed cleaning and coding methods.
Both Twitter and Flickr posts were queried using key words and a geographic bounding box. If a post contained any individual keyword, or was geotagged within the bounding box, it was downloaded into a raw dataset. The bounding box includes a range of latitudes and longitudes that make up an imaginary rectangle on the map (e.g., Hausmann et al. 2018), and the one used in this study encompassed both KATM and LACL. For both Flickr and Twitter, the bounding box for geotags was set at [-156.713358, 57.681894, -153.00000, 61.586310]. Twitter keywords queried included park names as both regular post text and hashtags (searchable phrases beginning with #), account handles (Twitter account names beginning with @), and names of two key locations as both tweet text and hashtags. The resulting query list included “katmai,” “#katmai,” “lake clark,” “#lakeclark,” “hallo bay,” “#hallobay,” “proenneke’s cabin,” “#proennekescabin,” “@katmainps,” and “@lakeclarknps.” However, queries related to these locations, Hallo Bay and Proenneke’s Cabin, were later discarded because of low return upon initial examination of results, leaving queries for the park names as tweet text and hashtags, as well as the park account handles. Because users on Flickr cannot tag other accounts, and do not typically use hashtags, Flickr was queried for posts including tags “katmai” or “lake clark.”
Data Cleaning and Analysis
Data was cleaned for duplicates, and each post was manually inspected to code for content (Richards and Friess 2015). Retweets and replies were removed from the dataset, and posts in a language that the reviewer did not understand were assessed using Google Translate and by inspecting media attachments. Each post was coded according to content using a visual inspection of both textual content and attached media, such as photos, videos, or links to external websites, and done by a person familiar with the area. Posts were coded as unrelated to the parks, nonvisit (posts about the parks but not indicating a visit; e.g., news stories), by location if the post was in Brooks Camp, or in an unclear location. Posts that were in backcountry and wilderness were coded by activity (Figure 1).
In order to limit bias resulting from a small number of active users, users’ posts were evaluated collectively, but each user was coded only once. If they appeared to engage in both fishing and bear viewing, they were coded as engaging in both. If none of the user’s posts indicated a bear viewing or fishing activity, it was coded as other (Table 1). In cases where the user shared content that fell into multiple categories, they were coded according to the activity closest to a backcountry visit (e.g., if posts were both unrelated and nonvisit, the user was coded as nonvisit; if they shared nonvisit and Brooks Camp content, they were coded as Brooks Camp; if posts shared both Brooks Camp and backcountry activities, they were coded by their backcountry activity).
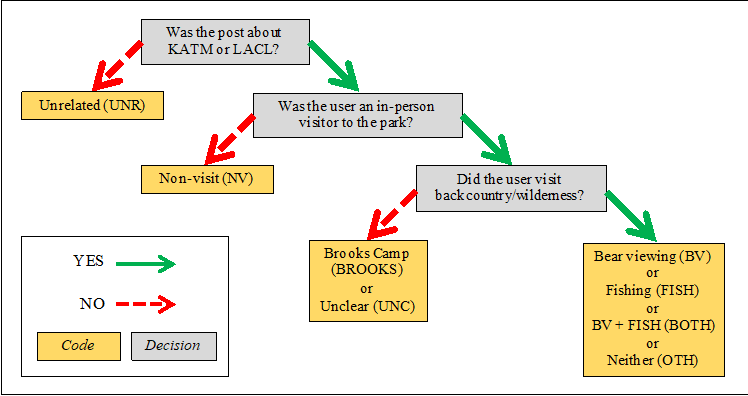
Figure 1 – Decision tree used to determine code for social media users through a visual inspection. Users’ posts were evaluated collectively, and the user was coded according to the category furthest to the right in this table (for example, if a user shared nonvisit content and backcountry bear viewing, they were coded as bear viewing). Table 1 includes detailed descriptions of each decision point.
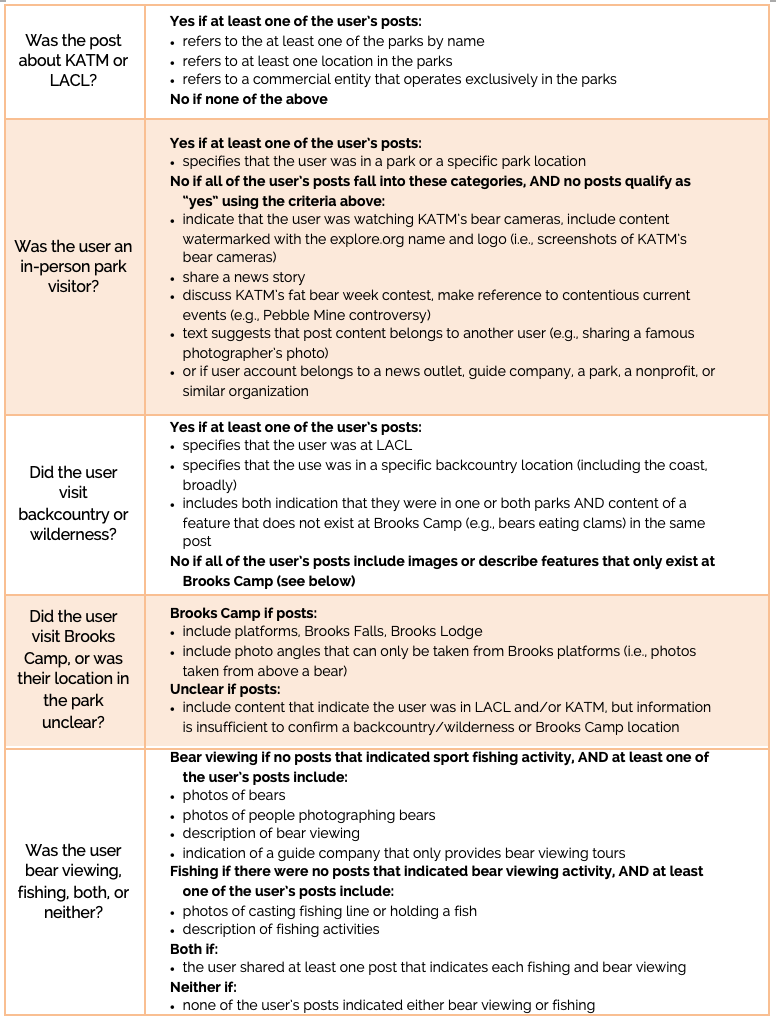
Table 1 – Codebook, which was used in combination with the decision tree in Figure 5 to evaluate user activities and locations
Descriptive statistics were used to evaluate the volume of social media users that were in-person visitors, as well as the frequencies of activity types. Geographic information was mapped using Google Earth and categorized based on location.
Results
Twitter and Flickr Content
In all, 46,768 Tweets were collected. After discarding retweets and replies, 11,795 Tweets representing 6,086 Twitter users remained. Of these users, 3,973 (65.3%) referenced the parks, as opposed to unrelated content (e.g., Tweets about the Clark/Lake transit station in Chicago, IL). Of the users who shared content about the parks, only 189 (3.1%) of these users were visitors (Table 2). A total of 789 Flickr posts were collected, and only one post did not reference the parks. In all, 34 unique Flickr users represented park visitors with one nonvisitor removed.
Unless otherwise noted, nonvisitors are excluded from all further analysis. Additionally, datasets were combined and social media users are evaluated as one group for the remainder of this article, unless otherwise noted. Of the 223 Twitter and Flickr users coded as in-person visitors, 144 were in backcountry locations, 54 at Brooks Camp, and 25 in locations that were unidentified (Table 3). The majority of backcountry users (73.6%) shared content related to bear viewing (Table 4).
Spatial Results
The majority of users with associated geographic information did not share content related to an in-person visit. A total of 1,834 social media posts, representing 158 unique users, contained associated geographic information. Only 31 of these users were in-person visitors, including 27 Twitter users and 4 Flickr users. This ratio closely reflects the ratio of total Twitter and Flickr visitors (189 and 34, respectively). A total of 31 observations is not sufficient for statistical analysis to have adequate power, but observational analysis can suggest potential characteristics of spatial data in this remote, low-visitation park.
Of the 31 total users with associated geographic data, 16 points were outside the parks (Table 5). Of those, 14 were associated with towns outside of the parks, one in Alaska Wilderness over 200 miles (322 km) northeast of LACL, and one was in Alagnak Wild River (an NPS unit that geographically connects to KATM). Of the 15 points that lay in the parks, three were in Brooks Camp, three were in the frequently visited backcountry areas of Chinitna Bay and Hallo Bay (SWAN 2017a, 2017b), one was along a river near the KATM coast, and eight were clustered in one point in KATM. These eight points were all derived from Twitter cross-posts of Instagram content that was manually tagged with Katmai National Park as the location. Because posts with a manual tag on Instagram select the same random point in the area to associate with, it is highly unlikely that the users actually visited this location (Figure 2).
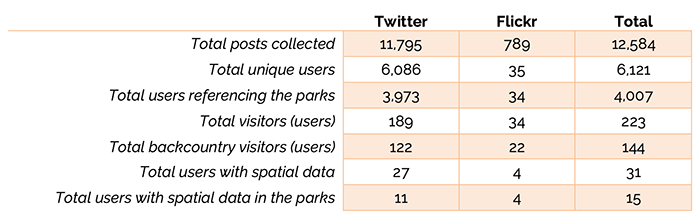
Table 2 – Summary of Twitter and Flickr content with text referencing the parks’ names or social media accounts, or geotagged in the parks, between June and October 2018
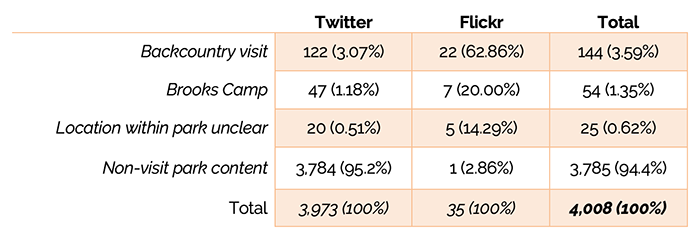
Table 3 – Frequencies of unique user locations of social media users who shared content related to Katmai and Lake Clark National Parks and Preserve, June–October 2018
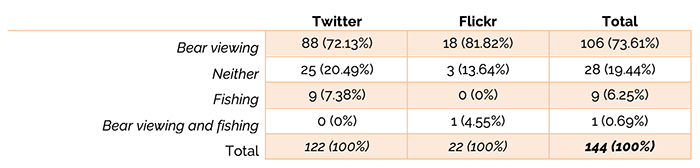
Table 4 – Frequencies (percentages) of unique user backcountry activities of social media users who shared content related to Katmai and Lake Clark National Parks and Preserve, June–October 2018
Discussion
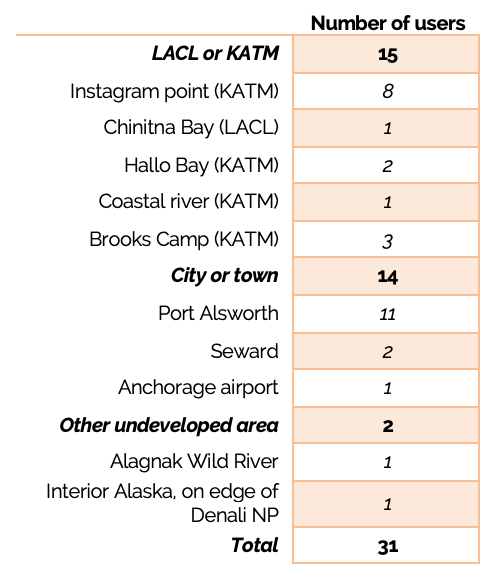
Table 5 – Visitor locations based on volunteered geographic information of users coded as in-person visitors to Katmai and Lake Clark National Parks and Preserves
While past studies have shown correlations between visitation, visitor activities, and spatial density in parks and protected areas, many studies note that these correlations are weaker in lower-use, more remote areas (e.g., Heikinheimo et al. 2017; Tenkanen et al. 2017; Sessions et al. 2016; Fisher et al. 2018; Walden-Schreiner et al. 2018a; Levin et al. 2017). By evaluating the content of posts related to two remote, low-visitation parks, this study investigates how well social media content in these areas represents in-person visitors. Capturing data using a wide net and manually identifying Tweets from actual visitors revealed that only 189 Twitter users who post about the parks are actual in-person visitors, compared with 3,784 users who shared content related to the parks but not related to an in-person visit. This suggests that while Twitter can be used to understand public perceptions of the park or media chatter about a park, it may not be as useful a tool for understanding visitors. The Flickr data revealed that while there were more than 700 posts from the parks, there were only 35 users sharing photos. In short, while there were 117 times more overall users on Twitter discussing the park and 6 times more Twitter users who visited the park compared with Flickr users, all of the Flickr users who shared content about the park were in-person visitors.
During the summer of 2018 there were 37,018 visitors to KATM and 12,952 visitors to LACL according to park statistics (NPS 2018b). When combining both parks, a sample size of 381 would be required for a +/- 5% margin of error (Vaske 2008). The total volume of users who were in-person visitors, 223 overall and 144 in the backcountry, is not a generalizable sample. This limitation is especially important to consider in the context of previous research, which has shown social media to overrepresent and underrepresent certain groups. It should be noted that previous studies in remote and sparsely used settings use larger spatiotemporal scales, which allows for more data to be collected. This suggests that scale is a primary consideration when using these data to understand visitors in such locations.
Additionally, these results suggest significant differences between platforms when using keywords to query for posts. While nearly all Flickr users were in-person visitors, Flickr yielded a very small sample. Twitter’s sample was significantly larger, but the amount of time required to identify users who were in-person visitors is likely too great to be of any managerial value.
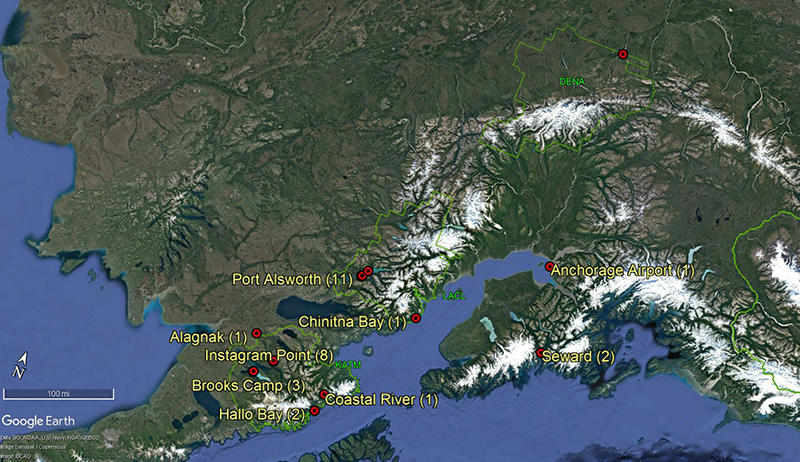
visiFigure 2 – Map of geographic information associated with in-person visitors. Labels and frequencies correspond with table 5.
Overall, there were enough social media users who were in-person visitors to make limited conclusions about social media use by visitors to KATM and LACL. However, 95% of Twitter users who posted about the parks were not visitors. While this does not suggest that social media content can never be used to estimate visitor volume in site- or season-specific contexts, it does highlight the need to explore in what cases it can be and how to do so. Future research may explore using multipliers or automating content evaluation. The majority of research uses geographic bounding boxes to query for posts in order to prevent the inclusion of non-visitors. In this study, which evaluates only one season of data at only two remote parks, that method would have only yielded 15 posts from visitors, 12 of which were in the backcountry or wilderness.
The distribution of activity types shared by social media users, compared with data reported by CUAs, relatively overestimates bear viewers relative to sport fishers (SWAN 2018a, 2018b). There are several possible reasons for this. For one, photography is more often combined with bear viewing than fishing in these parks (Sharp et al. 2019a, 2019b). This may also be because bear viewing is a more charismatic activity (i.e., users may perceive that it will return more positive feedback on social media). Future research may benefit from using the primary CUA data to make statistical comparisons between frequencies of CUA-reported activities and activities shared on social media.
While the distribution of activity types reported by CUAs and shared on social media may not align, the ratio of Brooks Camp versus backcountry visitors seems to align between CUA-reported data and social media content. It is not possible to quantify the similarity using just the reports generated by SWAN (2018a, 2018b); however, it appears that in 2017 there were approximately 13,500 user days at Brooks Camp and 25,000 user days at the remaining areas of KATM and all of LACL (numbers approximated from graphs in SWAN 2018a, 2018b); in other words, ~35% of CUA reported visitor use days were in Brooks Camp. Social media analysis revealed 54 Brooks Camp visitors and 144 backcountry visitors, or 27.2% Brooks Camp. Future research may also use primary CUA data to evaluate whether significant similarities or differences in locations exist.
Limitations
This is an in-depth study of just one season at just two parks; therefore, it is not necessarily generalizable to all wilderness areas. Rather, it serves to draw attention to possible applications and limitations related to using social media data to understand visitors in very remote contexts and at a fine spatial scale.
Additionally, technological barriers to social media data collection continue to limit researchers’ and managers’ ability to use it. While the data in this study was collected prior to March 2019, Flickr now severely restricts the number of photos they host for free users. Users who do not pay for their accounts will only be allowed to host 1,000 photos, and photos above that limit will be deleted from their site (Austin 2019). While only 3% of free users have shared more than 1,000 photos on Flickr, it is important to recognize that social media companies are private entities that can, and do, change what data is available at any time. This has already impacted researchers’ ability to use Instagram, a platform that arguably works best for understanding park visitors (Tenkanen et al., 2017; Heikinheimo at al., 2017). Instagram has, in the past, suddenly shut down access to its API and thus data (Volpicelli 2018).
Implications
Despite the limitations in using social media to understand in-person visitors, high social media attention from nonvisitors may be useful for the park in terms of extending the reach of their education or conservation messages (Skibins and Sharp 2018). In this sense, online users who share content related to parks can be considered a demographic of “digital” park visitor. In KATM, it is especially relevant to consider engagement with nonvisiting online users, as the park’s bear-viewing livestream reaches more than 10 million people. Given the difficulty in reaching this remote site, when evaluating livestream viewers, these online-only “digital visitors” are economically valued at more than twice that of in-person visitors (Loomis et al. 2018).
Overall, the results of this study suggest that using social media data at a fine scale in a remote, low-visitation area has limited use. Additionally, the vast majority of social media users who share content about parks on Twitter were not in-person park visitors. Overall, consideration of methods and scale should be used when collecting and interpreting user-generated content. Additionally, the analysis of post content took an extraordinary amount of time and effort. While in this case using just a geographic bounding box would have yielded very few observations, the added value of the additional observations obtained by querying and evaluating post content must be weighed against the cost to the researcher.
“Overall, the results of this study suggest that using social media data at a fine scale in a remote, low-visitation area has limited use. Additionally, the vast majority of social media users who share content about parks on Twitter were not in-person park visitors.”
This study does not conflict with the work that other researchers have done, evaluating whether there is a correlation between reported visitation and social media volume when comparing many sites or over many years. Rather, it suggests that consideration needs to be paid to the scale and interpretation of results. Additionally, this study affirms that queries using spatial data to search for posts, as opposed to post content, is indeed filtering out a large number of nonvisitors. This was especially clear with regards to studies using Twitter data. So, the application of this data in this context is limited; to have sufficient data, questions should be asked on larger spatial and/or temporal scales.
Qualitatively understanding user-generated content can enhance other metrics and can contribute to a well-rounded understanding of what visitors do in parks and protected areas. However, there may be a bias toward certain activities, perhaps those that more naturally include photography or are more photogenic. Future research may further investigate how visitors’ perceptions of social media likability influences what they choose to share. Additionally, future research may adapt the visual inspection methods used in this analysis to investigate whether automated content analysis or machine learning can identify posts shared by in-person visitors. Finally, future research may explore how proximity to cellular signal or internet influences the volume of user-generated content created and shared by in-person visitors, or whether backcountry and wilderness users have different behaviors related to technology than front country or urban-proximate visitors, and how these constraints affect the representativeness of social media samples in these settings.
DANI T. DAGAN is a PhD student at Clemson University, Department of Parks, Recreation, & Tourism Management; email: ddagan@clemson.edu.
RYAN L. SHARP is an associate professor in the Applied Park Science Lab within the Department of Horticulture and Natural Resources at Kansas State University; email: ryansharp@ksu.edu.
MATTHEW T. J. BROWNLEE is an associate professor of Parks and Conservation Management and director of the Park Solutions Lab at Clemson University, Department of Parks, Recreation, & Tourism Management; email: mbrownl@clemson.edu.
EMILY J. WILKINS is a PhD candidate at Utah State University, Department of Environment and Society; email: emily.wilkins@aggiemail.usu.
References
Arapostathis, S. G., N. Spyrou, G. Drakatos, K. Kalabokidis, E. Lekkas, and G. Xanthopoulos. 2018. Mapping information related to floods, extracted from VGI sources, for effective disaster management within the Greek territory; the floods of West Attica (November 2017 Greece) case study. In 11th International Conference of the Hellenic Geographical Society.
Austin, P. L. 2019. February 7. Flickr is about to delete tons of photos. Here’s how to save yours before they’re gone. TIME. https://time.com/5520636/flickr-delete-photos-export-save/.
Boley, B. B., E. J. Jordan, C. Kline, and W. Knollenberg. 2018. Social return and intent to travel. Tourism Management 64: 119–128.
Cahill, K., R. Collins, S. McPartland, A. Pitt, and R. Verbos. 2018. Overview of the Interagency Visitor Use Management Framework and the uses of social science in its implementation in the National Park Service. The George Wright Forum 35(1): 32.
Cessford, G., and A. Muhar. 2003. Monitoring options for visitor numbers in national parks and natural areas. Journal for Nature Conservation 11(4): 240–250.
Chua, A., L. Servillo, E. Marcheggiani, and A. V. Moere. 2016. Mapping Cilento: Using geotagged social media data to characterize tourist flows in southern Italy. Tourism Management 57: 295–310.
Explore. (N.d.). Brooks Falls brown bears. Explore.org. https://explore.org/livecams/brown-bears/brown-bear-salmon-cam-brooks-falls.
Fay, G., S. Colt, and E. M. White. 2010. Data Survey and Sampling Procedures to Quantify Recreation Use of National Forests in Alaska. General Technical Report PNW-GTR-808. Portland, OR: US Department of Agriculture, Forest Service, Pacific Northwest Research Station, 808.
Fisher, D. M., S. A. Wood, E. M. White, D. J. Blahna, S. Lange, A. Weinberg, M. Tomco, and E. Lia. 2018. Recreational use in dispersed public lands measured using social media data and on-site counts. Journal of Environmental Management 222: 465–474.
Goodchild, M. F. 2007. Citizens as sensors: The world of volunteered geography. GeoJournal 69(4): 211–221.
Griffin, G. P., and J. Jiao. 2015. Where does bicycling for health happen? Analysing volunteered geographic information through place and plexus. Journal of Transport & Health 2(2): 238–247.
Hamstead, Z. A., D. Fisher, R. T. Ilieva, S. A. Wood, T. McPhearson, and P. Kremer. 2018. Geolocated social media as a rapid indicator of park visitation and equitable park access. Computers, Environment and Urban Systems 72: 38–50.
Hausmann, A., T. Toivonen, R. Slotow, H. Tenkanen, A. Moilanen, V. Heikinheimo, and E. Di Minin. 2018. Social media data can be used to understand tourists’ preferences for nature‐based experiences in protected areas. Conservation Letters 11(1): e12343.
Haworth, B., and E. Bruce. 2015. A review of volunteered geographic information for disaster management. Geography Compass 9(5): 237–250.
Hecht, B. J., and M. Stephens. 2014. A tale of cities: Urban biases in volunteered geographic information. ICWSM 14: 197–205.
Heikinheimo, V., E. D. Minin, H. Tenkanen, A. Hausmann, J. Erkkonen, and T. Toivonen. 2017. User-generated geographic information for visitor monitoring in a national park: A comparison of social media data and visitor survey. ISPRS International Journal of Geo-Information 6(3): 85.
Hendee, J. C., and C. P. Dawson. 2002. Wilderness Management: Stewardship and Protection of Resources and Values, 3rd ed. Golden, CO: Fulcrum Publishing.
Hollenhorst, S. J., S. A. Whisman, and A. W. Ewert. 1992. Monitoring Visitor Use in Backcountry and Wilderness: A Review of Methods. General Technical Report PSW-134. Berkeley, CA: Pacific Southwest Research Station, Forest Service, US Department of Agriculture.
Jacob, G. R., and R. Schreyer. 1980. Conflict in outdoor recreation: A theoretical perspective. Journal of Leisure Research 12(4): 368–380.
Khang, H., E. J. Ki, and L. Ye. 2012. Social media research in advertising, communication, marketing, and public relations, 1997–2010. Journalism & Mass Communication Quarterly 89(2): 279–298.
Kyle, G., A. Graefe, R. Manning, and J. Bacon. 2003. An examination of the relationship between leisure activity involvement and place attachment among hikers along the Appalachian Trail. Journal of Leisure Research 35(3): 249–273.
Levin, N., A. M. Lechner, and G. Brown. 2017. An evaluation of crowdsourced information for assessing the visitation and perceived importance of protected areas. Applied Geography 79: 115–126.
Loomis, J., L. Richardson, C. Huber, J. Skibins, and R. Sharp. 2018. A method to value nature-related webcam viewing: The value of virtual use with application to brown bear webcam viewing. Journal of Environmental Economics and Policy 7(4): 452–462.
Mancini, F., G. M. Coghill, and D. Lusseau. 2018. Using social media to quantify spatial and temporal dynamics of nature-based recreational activities. PloS One 13(7): e0200565.
Manning, R. E. 2010. Studies in Outdoor Recreation: Search and Research for Satisfaction. Corvallis: Oregon State University Press.
Marion, J. L. 2016. A review and synthesis of recreation ecology research supporting carrying capacity and visitor use management decision-making. Journal of Forestry 114(3): 339–351.
National Park Service. 2018a. Petroglyphs National Monument visitor use management plan / Environmental Assessment. US Department of the Interior. https://parkplanning.nps.gov/document.cfm?parkID=89&projectID=66887&documentID=91665.
———. National Park Service Visitor use statistics. https://irma.nps.gov/Stats/.
———. 2016. Parks with wilderness. https://www.nps.gov/subjects/wilderness/wilderness-parks.htm.
———. 1991. Natural Resource Management Reference Manual #77. NPS-77. Washington, DC: National Park Service.
Pastur, G. M., P. L. Peri, M. V. Lencinas, M. García-Llorente, and B. Martín-López. 2016. Spatial patterns of cultural ecosystem services provision in Southern Patagonia. Landscape Ecology 31(2): 383–399.
Richards, D. R., and D. A. Friess. 2015. A rapid indicator of cultural ecosystem service usage at a fine spatial scale: Content analysis of social media photographs. Ecological Indicators 53: 187–195.
Sessions, C., S. A. Wood, S. Rabotyagov, and D. M. Fisher. 2016. Measuring recreational visitation at US national parks with crowd-sourced photographs. Journal of Environmental Management 183: 703–711.
Sharp, R. L., M. T. J. Brownlee, and D. T. Dagan. 2019a. Visitor Use and Associated Indicators at Katmai National Park and Preserve. Interim report delivered to Katmai National Park and Preserve.
———. 2019b. Visitor Use and Associated Indicators at Lake Clark National Park and Preserve. Interim report delivered to Lake Clark National Park and Preserve.
Skibins, J. C., and R. L. Sharp. 2018. Binge watching bears: Efficacy of real vs. virtual flagship exposure. Journal of Ecotourism 18(2): 152–164.
Southwest Alaska Inventory and Monitoring Network. 2018a. Katmai National Park and Preserve visitor use. National Park Service. https://irma.nps.gov/Datastore/Reference/Profile/2251836.
———. 2018b. Lake Clark National Park and Preserve visitor use. National Park Service. https://irma.nps.gov/Datastore/Reference/Profile/2251837.
———. 2017a. Katmai National Park and Preserve visitor use. National Park Service. https://irma.nps.gov/DataStore/Reference/Profile/2239958.
———. 2017b. Lake Clark National Park and Preserve visitor use. National Park Service. https://irma.nps.gov/DataStore/Reference/Profile/2239957.
Tenerelli, P., U. Demšar, and S. Luque. 2016. Crowdsourcing indicators for cultural ecosystem services: A geographically weighted approach for mountain landscapes. Ecological Indicators 64: 237–248.
Tenkanen, H., E. Di Minin, V. Heikinheimo, A. Hausmann, M. Herbst, L. Kajala, and T. Toivonen. 2017. Instagram, Flickr, or Twitter: Assessing the usability of social media data for visitor monitoring in protected areas. Scientific Reports 7(1): 17615.
van Zanten, B. T., D. B. Van Berkel, R. K. Meentemeyer, J. W. Smith, K. F. Tieskens, and P. H. Verburg. 2016. Continental-scale quantification of landscape values using social media data. Proceedings of the National Academy of Sciences 113(46): 12974–12979.
Vaske, J. J. 2008. Survey Research and Analysis: Applications in Parks, Recreation and Human Dimensions. Urbana, IL: Venture Publishing
Volpicelli, G. 2018. April 28. Can Instagram keep its nose clean? The Guardian. https://www.theguardian.com/technology/2018/apr/28/instagram-at-the-crossroads-profits-facebook-data-scandal-politics-influencers-mental-health.
Walden-Schreiner, C., Y. F. Leung, and L. Tateosian. 2018a. Digital footprints: Incorporating crowdsourced geographic information for protected area management. Applied Geography 90: 44–54.
Walden-Schreiner, C., S. D. Rossi, A. Barros, C. Pickering, and Y. F. Leung. 2018b. Using crowd-sourced photos to assess seasonal patterns of visitor use in mountain-protected areas. Ambio 47(7): 781–793.
Wood, S. A., A. D. Guerry, J. M. Silver, and M. Lacayo. 2013. Using social media to quantify nature-based tourism and recreation. Scientific Reports 3: 2976.
Read Next
Of Global Concern: Reliance upon Resilience
There is no argument that the Australia bushfires are of global concern, but what may be of more concern is the lack of a greater resonance across the globe. If nature can no longer react and response to threats, then nature must rely upon us.
Wilderness Trails: Influences of Perceptions
Wilderness areas may not be perfect, and there may be some rules, but without a doubt they benefit society, and it is imperative that society can access those benefits. Trails are a perfect guide leading people to those benefits.
The Toda People: Stewards of Wilderness and Biodiversity
At a period when humankind appears to be so disconnected with nature that they assume their species can survive without respecting other forms of life, it might be pertinent to see how a traditional Toda mind is trained to interact with nature.