International Perspectives
December 2015 | Volume 231, Number 3
by MARTIN HAWES, ROGER LING, and GRANT DIXON
Introduction
The values associated with wilderness are diverse and sometimes subtle, and cannot be fully accounted for in quantitative terms (Landres et al. 2008). For example, no amount of data can fully convey the ecological significance of a pristine landscape, nor can one measure the sense of awe that a visitor might feel when standing in its midst. It is nevertheless possible to identify some of the key physical and geographical attributes that are necessary and sufficient for an area to qualify as wilderness, and to a large extent it is possible to quantify these attributes. Assessments based on such measurements can be used to estimate the extent and quality of existing or potential wilderness across a given region and can be a useful tool for protecting, maintaining, and enhancing wilderness values. In this article, the term wilderness value will be used to denote the extent to which a place or region exhibits key physical and geographical attributes that may define it as wilderness.
A number of wilderness-assessment methodologies have been developed, ranging from simple area-counts to complex algorithms that take a wide range of factors into account. In the United States, for example, mapping methodologies have been developed to monitor and manage wilderness character, based on indicators such as untrammeled quality and remoteness from occupied areas (Landres et al. 2008; Tricker et al. 2013). While some methodologies take account only of geographical conditions such as the location of roads, others incorporate subjective assessments contributed by wilderness users and/or the general public (Kliskey and Kearsley 1993; Carver et al. 2002).
In the mid-1980s the Australian Heritage Commission developed a wilderness-assessment methodology as the basis for a nationwide wilderness inventory (Lesslie and Maslen 1995). The National Wilderness Inventory (NWI) methodology identifies remoteness and naturalness as the key components of wilderness value, defining remoteness as distance from human structures and disturbances such as buildings, dams, and logging areas. Rather than attempting to distinguish wilderness from nonwilderness, the methodology assesses wilderness value as a continuum ranging from urban to pristine. The methodology was used to assess wilderness value across Tasmania and other parts of Australia in the late 1980s and 1990s, and it has since formed the basis for several studies in Europe (Henry and Husby 1995; Carver et al. 2002).
Although the NWI methodology is the most comprehensive wilderness-assessment methodology yet developed in Australia, it has some deficiencies. In particular, it takes no account of the influence of terrain and vegetation on access remoteness. In an attempt to address this deficiency, British researchers Fritz and Carver (1998) developed an algorithm for taking walking times into account, based on assumptions about walking speeds across different gradients of terrain. Similar algorithms have been employed in subsequent wilderness-value surveys (e.g., Tricker et al. 2013).
The current study focused on the Tasmanian Wilderness World Heritage Area (TWWHA) – a 1.4-million hectare (3.5 million acre) region (expanded to 1.6 million hectares in 2013 since this study was undertaken) that encompasses one of the last great tracts of temperate wilderness on Earth (Parks and Wildlife Service 1999). It is a wild and largely undeveloped (i.e., free of the impacts and infra- structure of modern civilization) part of Tasmania, Australia’s island state, containing a range of natural and indigenous cultural values that led to the listing as a World Heritage Area in 1982. The landscape includes formerly glaciated mountain ranges, thickly forested valleys, open plains, and an extensive rugged coastline. While it contains in excess of 1,300 kilometers (808 miles) of mostly rough walking tracks (trails), much of the country is untracked. The area hence provides some of the best opportunities for self-reliant recreation in the Australasian region.
Prior to the NWI assessment, at least two attempts had been made to assess the wilderness values of the region that is now the TWWHA. Kirkpatrick and Haney (1980) calculated wilderness values across a 4 kilometer x 4 kilometer (2.49 mile x 2.49 mile) grid (refined to 2 km x 2 km [1.24 mile x 1.24 mile] where boundaries were complex). They defined wilderness value as a function of the remoteness and biophysical primitiveness of each square, and defined remoteness as the time required to access the location on foot. Hawes and Heatley (1985) took a simpler approach, defining wilderness as land more than eight kilometers (4.97 miles) (nominally a half walking day) from the nearest roads, dams, and similar disturbances. Using this definition they assessed the potential impact on wilderness of projected logging operations in areas adjacent to the then recently listed TWWHA. The NWI approach was applied state-wide in 1995 as part of a process (the Regional Forest Agreement) to identify areas that qualified for reservation from future industrial-scale logging. This 1995 assessment formed the comparative baseline for the current study.
The first objective of the current study was to assess the changes in wilderness value that had occurred across the TWWHA since 1995 by reapplying the NWI methodology (as described below) to the region using updated geodata. The second objective was to repeat the assessment of current wilderness value using a revised methodology that was designed to address some of the deficiencies mentioned earlier.
No attempt was made in this study to assess the impact of view-field disturbances, although it was acknowledged that development of such a technique could enhance future wilderness-value mapping.
Measuring Wilderness Values Using the NWI Methodology
Component Variables of Wilderness Value
In the NWI methodology, the variable Wilderness Value (WV) is assigned to each square in a grid covering the region of interest. The grid resolution can be selected to suit the size of the region and the resources available for the analysis. A 1 kilometer (0.62 mile) grid was used for this study (see Map 1).
Wilderness Value was measured as the sum of four variables: Remoteness from Settlement (RS), Remoteness from Access (RA), Apparent Naturalness (AN), and Biophysical Naturalness (BN). The first three of these variables are distance based, the value assigned to each grid square depending on the remoteness of the square’s center from specified types of geographical features. Each category of geographical feature is assigned a weighting to reflect its relative impact on wilderness values. For example, it is assumed that roads have substantially greater impact on wilderness values than walking tracks (trails). In the formula for calculating Remoteness from Access (RA), walking tracks and roads are weighted so that the impact of a walking track one kilometer (.62 mile) distant is equivalent to that of a major road 9 kilometers (5.59 miles) distant.
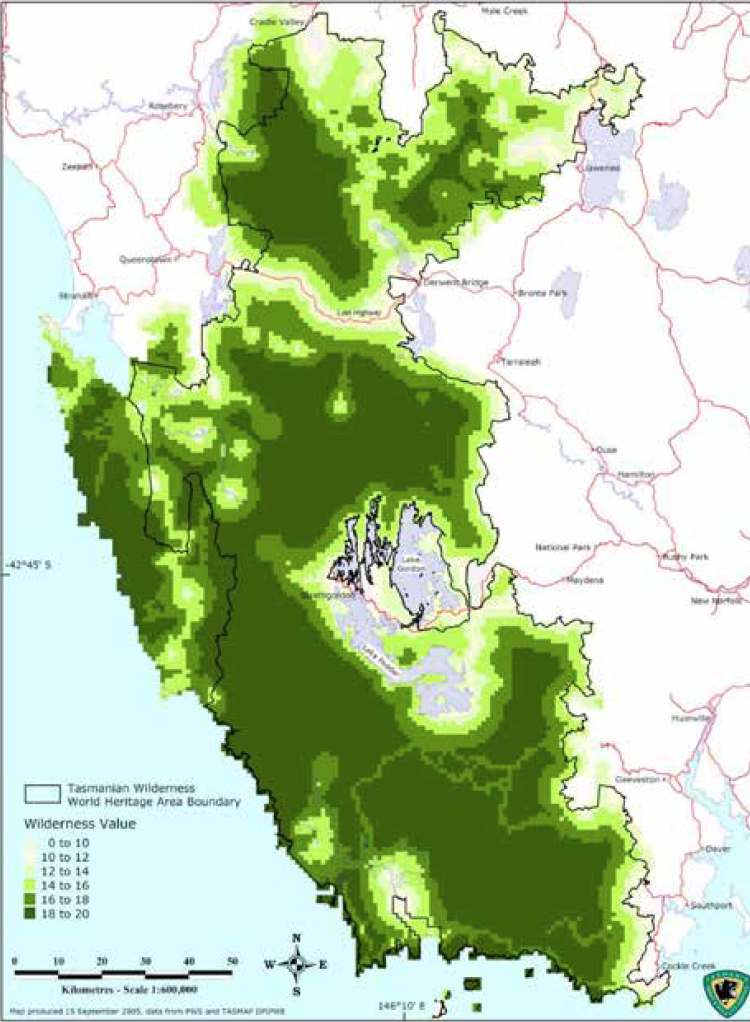
Map 1 – Distribution of wilderness values in 2005 calculated using the National Wilderness Inventory (1995) methodology; 1-kilometer (.62 mile) grid. The maps show the TWWHA boundary in 2005, at the time the study was undertaken. As noted in the text, the reserve was expanded somewhat in 2013.
The relationship is illustrated in Figure 1; the curves illustrate the formulas used to calculate Remoteness from Access as a function of distance from various geographic features. For example, a location 5 kilometers (3.11 miles) from a walking track would have an RA value of approximately 7. If the point were also 10 kilometers (6.21 miles) from a major road, its RA value would be reduced to 4.
Remoteness from Settlement is a function of the minimum map distance from towns and smaller settlements, weighted according to population. Apparent Naturalness, which is a measure of how “wild” or “undeveloped” an area might seem to a visitor, is a function of the distance from the nearest nonnatural features such as roads, impoundments, and transmission lines.
Biophysical Naturalness values are determined by environmental conditions (such as logging and grazing history) within each square and measured on a scale of 1–5 with values determined by a list of condition classes.
The study area encompassed the entire TWWHA (as per its 2005 boundaries), together with adjacent areas that were largely free of major development features such as dams or roads. Wilderness values within the study area were calculated using data on geographical features located within a 30-kilometer (18.6 mile) radius of the area.
Data Sources
The primary data source for the study was the Tasmanian government’s GIS database, which contains geodata on roads, impoundments, vegetation types, and a wide range of other geographical features. These data were supplemented by information from a variety of sources, including satellite imagery and local knowledge. For example, some clearfelled (clear-cut) areas that were visible on satellite images but not recorded on available GIS layers were manually traced from georeferenced satellite imagery using the MapInfo polygonal drawing tool. Most of the data sources were known to have been current in 2002 or later.
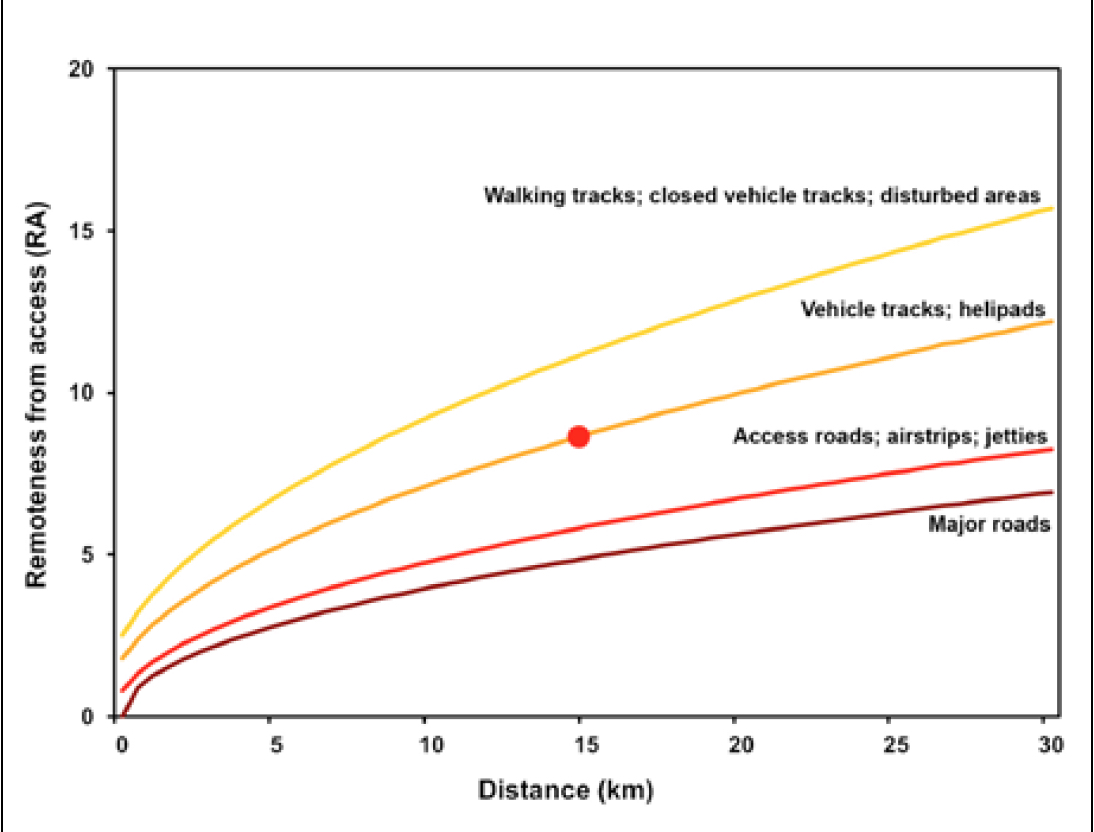
Figure 1 – Remoteness from Access varies according to the map remoteness from different types of geographic features. For example, a location 15 kilometers (9.32 miles) from a helipad (indicated by the red dot) would have an RA rating of approximately 7.
The analysis was undertaken using MapInfo Professional software and the scripting language MapBasic. The latter was used to calculate the minimum distance from the centroid of each grid square in the study area to the nearest relevant point, polyline, or polygonal disturbance feature (such as a road or an area of logged forest). The calculation was made by creating a small circular search zone around each centroid, and progressively increasing the radius of the zone until the relevant feature was found.
The authors had access to the output data from the 1995 analysis, but not to the geodata on which this analysis was based. Hence it was possible to compare the wilderness value measured in 1995 and 2005, but it was not possible to explain all the observed differences.
Developing a Modified Wilderness-Assessment Methodology
Rationale for Modifying the Methodology
As noted earlier, the NWI methodology has a number of shortcomings. The principle shortcomings are:
- Remoteness of Access as defined under the NWI system is not a reliable indicator of the time required to access off-road areas because it takes no account of terrain, vegetation, or the standard of walking tracks. For example, two locations 5 kilometers (3.11 miles) from the nearest road can have the same RA rating, even though one may be accessed in a couple of hours across open country and the other may take days to reach through Tasmania’s notoriously dense
- The weightings assigned to some categories of geographical feature under the NWI methodology are arguably inappropriate. For example, a walkers’ hut (cabin) has the same impact locally on wilderness value as a major road or hydroelectric impoundment.
Details of the Modifications
The primary modification was to replace the variable Remoteness of Access with a new variable, Time Remoteness (TR), defined as the shortest nonmechanized traveling time from points and corridors of mechanized access. It is possible to write computer algorithms to calculate Time Remoteness using GIS data on vegetation types, terrain slopes, and typical walking speeds (e.g., Tricker et al. 2013). However such algorithms can never be entirely reliable because they cannot take account of local (unmapped) factors such as variations in the density of forest understory and the impassability or otherwise of steep terrain. They also require computing resources beyond those available for the current study (Fritz and Carver 1998).
Time Remoteness was therefore assessed manually by the authors, using map-based information supplemented by their own firsthand knowledge of the TWWHA. The risk of bias in this approach was considered to be adequately minimized by the fact that each of the authors had walked extensively throughout the region over a period of 40 years. Specifically, the authors identified “contours” of access remoteness that were respectively half a day, one day, and two days remote by foot or raft from the nearest point of mechanized access, thereby dividing the region into four zones that were subsequently assigned numerical TR values.
Changes were also made to the weighting conventions for RS and AN to correct the anomalies noted in (2), earlier. For example, small settlements were given slightly lower weightings relative to large towns.

Map 2 – Change in wilderness values that have occurred between 1995 and 2005, calculated using the National Wilderness Inventory (1995) methodology; 1 kilometer (.62 mile) grid.
The variables Remoteness from Settlement and Apparent Naturalness were redefined as functions that increase asymptotically to 5 as remoteness increases. Using this approach, changes in wilderness value can be analyzed even in very remote areas because the “perfect” value of 20 can never be reached.
Results
Assessment of Current (2005) Wilderness Values Using the NWI Methodology
Map 1 shows the distribution of current wilderness values using the NWI methodology. For the sake of simplicity, Maps 1–3 show only major roads and towns. Wilderness Values of less than 10 have been combined as a single group because they correspond to areas of low to very low wilderness value and are of less interest in terms of wilderness management.
Map 1 reveals that a substantial part of the entire region has wilderness value in the range of 18–20, the highest category under the NWI system. Areas with lower wilderness value are located mainly around the fringes of the region.
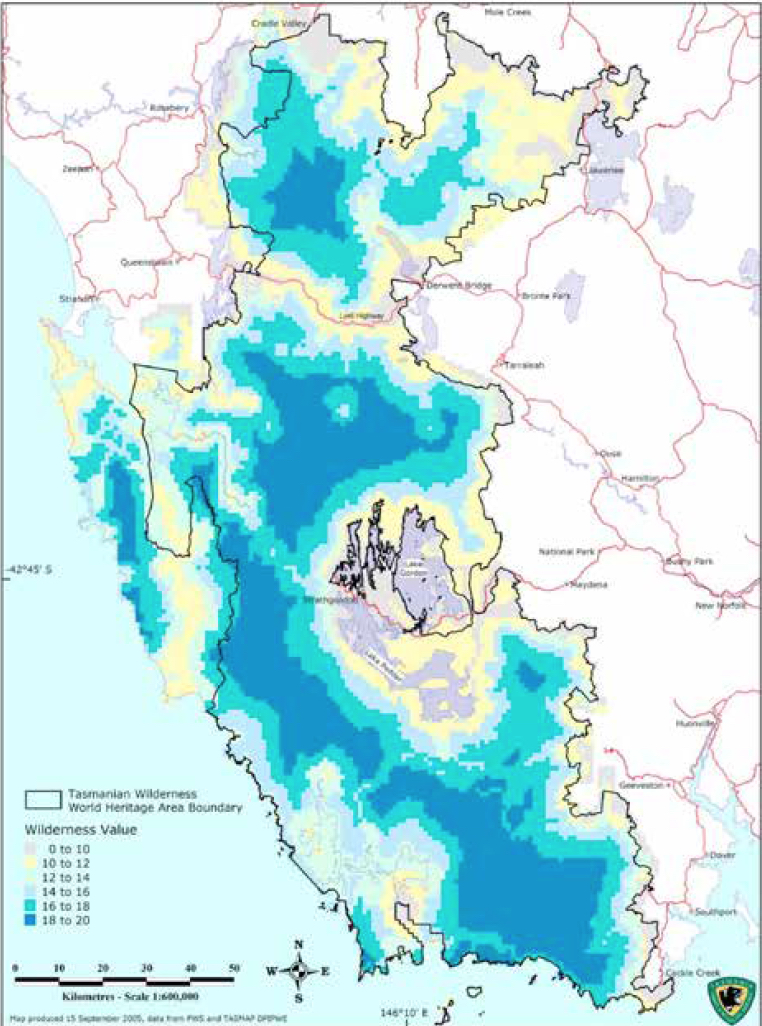
Map 3 – Distribution of wilderness values in 2005 using the revised methodology described herein; 1 kilometer (.62 mile) grid. Note the zones in this map cannot be directly compared to those in Map 1, as they have been derived by a different methodology.
Note the dramatic impact of hydroelectric impoundments, such as the two large impoundments near the center of the map, and of the Lyell Highway, which dissects the region along an east-west axis. Note also the impact of walking tracks, which account for the corridors of lighter shading in some of the more remote areas.
The isolated but substantial “holes” in regions of high wilderness value are mainly due to the presence of remote buildings. The large area of low wilderness value in the southwest corner of the region is due to the presence of a settlement that includes buildings, a mine, and an airstrip.
Comparison of Wilderness Values, 1995–2005
Map 2 shows the changes in wilderness value that occurred between 1995 and 2005. No significant losses or gains in Wilderness Value were recorded in areas shaded with neutral gray. The darker red areas recorded a reduction in WV of at least 5, and the darker green areas recorded an increase of at least 5.
Most of the wilderness losses correspond to known developments such as recent tourist infrastructure or the expansion of walking tracks. Some apparent losses appear to be explained by the omission of features such as vehicle tracks from the original 1995 dataset. (Since the dataset is unavailable, this cannot be confirmed.)
Most of the gains in Wilderness Value can be explained by the closure, removal, or natural reclamation of features such as vehicle tracks, airstrips, and huts.
Assessment of Current (2005) Wilderness Values Using the Revised Methodology
Map 3 shows the current distribution of Wilderness Values across the TWWHA as measured by the revised methodology. Note that because they were derived by a different methodology, the zones in this map cannot be directly compared to those in Map 1. While the overall picture is not greatly different from that obtained using the original NWI methodology, closer inspection reveals significant differences.
One difference is that the revised methodology indicates higher impacts due to major artificial features such as roads and impoundments, and lower impacts due to buildings and low-grade walking tracks. Also in the revised methodology, powered-boat access has a major impact on wilderness values on the west and southwest coast because points on coastlines where powered boats can easily put ashore are assigned a Time Remoteness value of zero.
In some areas, significant changes in the distribution of Wilderness Value are evident as a result of the inclusion of vegetation and terrain in the calculation of Time Remoteness. The greatest disparity between Time Remoteness and Remoteness from Access occurs in the northeast of the study area, where walking speeds are generally quite fast (due to the relative openness of country in this area).
Discussion
The NWI methodology remains the most comprehensive system yet employed for quantitatively assessing wilderness value in Australia. The main advantage of using the methodology in its original form is that this allows comparison with studies that have used the same methodology, either in other areas or in the same area at a different time.
The revised methodology proposed in this article corrects several shortcomings of the NWI methodology. In particular, the replacement of Access Remoteness with Time Remoteness highlighted the impact of mechanized boat access and deemphasized the impact of minor walking tracks on Wilderness Value. If sufficient resources were available, automating the assessment of Time Remoteness would increase the reproducibility of this variable. This approach has been adopted, for example, by Tricker et al. (2013) and Carver et al. (2013). However, the accuracy and reliability of automated calculations will depend on the extent to which available data such as vegetation type and terrain maps can be interpreted to estimate typical walking speeds.
An important caution for any approach to wilderness mapping utilizing spatial data, highlighted by Tricker et al. (2013), is to be mindful of the source data (e.g., accuracy, completeness, and scale of any GIS layer) when considering any resultant wilderness quality maps. It is also important to note that maps such as those derived in this study do not necessarily represent the less tangible or more personal qualities of wilderness, the perception of which inevitably varies with the individual.
The NWI and revised methodologies are based solely on geographical data. However, both methodologies inevitably involve subjective decisions about the influence of factors such as accessibility and naturalness. In future studies it may be possible to make this subjectivity more explicit by allowing wilderness users and other interested parties to assign their own weightings to identified components of wilderness value (such as the impact of huts, tracks, or roads), as proposed by Carver et al. (2002) and other researchers, but this approach does not yet seem to have been pursued.
The wilderness concept, and wilderness-value mapping in particular, has to some extent fallen out of favor in Australia in recent years. Sawyer (2015) postulates various reasons for this, ranging from a narrowing view of the rationale for conservation by ecologists to its inconvenience for various political agendas. Nevertheless public concern for wilderness remains strong, as shown by the controversy generated by the 2014 release of a draft management plan for the TWWHA (ABC News 2015) that deemphasizes wilderness and greenlights mechanized access and tourism development in remote areas (DPIPWE 2014). Perhaps partly in response to this controversy, the Tasmanian government has now embarked on a program to remap the wilderness values of the TWWHA.
In a global context the importance of wilderness remains widely recognized. Wilderness has been assigned its own category under IUCN’s classification system for protected areas (Dudley et al. 2012), and wilderness preservation is an explicit management objective for many national parks and similar reserves around the world (Suh and Harrison 2005). As a tool for objectively assessing the likely impact of proposed developments on wilderness quality, and for determining the extent and condition of the planet’s remaining wilderness areas, wilderness mapping has the potential to play an important role in achieving this objective.
MARTIN HAWES is a Tasmanian-based wilderness and walking tracks (trails) management consultant, who spends much of his spare time walking off-track; email martin@twelveprinciples.net.
ROGER LING is a spatial analyst at the Parks and Wildlife Service, enjoying the geochallenges of the Tasmanian bush; email roger.ling@parks.tas.gov.au.
GRANT DIXON has worked on backcountry management issues for the Tasmania Parks and Wildlife Service for more than 26 years but is embarking on a new life and spending more time in the wilderness; email grantdixon@iinet. net.au.
VIEW MORE CONTENT FROM THIS ISSUE
References
ABC News. 2015. Retrieved from www. abc.net.au/news/2015-03-03/ pressure-stepped-up-over-wilderness- plan-changes/6277500.
Carver, S., A. Evans, and S. Fritz. 2002. Wilderness attribute mapping in the United Kingdom. International Journal of Wilderness 8(1): 24–29.
Carver, S., J. Tricker, and P. Landres. 2013. Keeping it wild: Mapping wilderness character in the United States. Journal of Environmental Management 131: 239–255.
DPIPWE. 2014. Draft Tasmanian Wilderness World Heritage Area Management Plan. Hobart, Australia: Department of Primary Industries, Parks, Water and Environment.
Dudley, N., C. Kormos, H. Locke, and V. Martin. 2012. Defining wilderness in IUCN. International Journal of Wilderness 18(1):9–14.
Fritz, S., and S. Carver. 1998. Accessibility as an important wilderness indicator: Modelling Naismith’s Rule. Retrieved from http:// www.geog.leeds.ac.uk/papers/98-7/.
Hawes, M., and D. Heatley. 1985. Wilderness Assessment and Management: A Discussion Paper. Hobart, Australia: The Wilderness Society.
Henry, D., and E. Husby. 1995. Wilderness quality mapping in the Euro-Arctic Barents region: A potential management tool. Retrieved from http://gis.esri.com/library/ userconf/proc95/to150/p113.html.
Kirkpatrick, J. B., and R. A. Haney. 1980. The quantification of developmental wilderness loss. Search 11(10): 331–335.
Kliskey, A. D., and G. W. Kearsley. 1993. Mapping multiple perceptions of wilderness in southern New Zealand. Applied Geography 13: 203–223.
Landres, P., C. Barns, J. Dennis, T. Devine, P. Geissler, C. McCasland, L. Merigliano, J. Seastrand, and R. Swain. 2008. Keeping It Wild: An Interagency Strategy to Monitor Trends in Wilderness Character Across the National Wilderness Preservation System. General Technical Report RMRS-GTR-212. Fort Collins, CO: USDA Forest Service, Rocky Mountain Research Station.
Lesslie, R., and M. Maslen. 1995. National Wilderness Inventory Australia: Handbook of Procedures, Content and Usage, 2nd ed. Canberra: Australian Heritage Commission.
Parks and Wildlife Service. 1999. Tasmanian Wilderness World Heritage Area Management Plan.
Sawyer, N. 2015. Wilderness quality mapping – the Australian experience. In Science and Stewardship to Protect and Sustain Wilderness Values: Tenth World Wilderness Congress Symposium, 2013, 4–10 October, Salamanca, Spain, comp. A. Watson, S. Carver, Z. Křenová, and B. McBride (pp. 100–108). Proceedings RMRS-P-74. Fort Collins, CO: USDA Forest Service, Rocky Mountain Research Station.
Suh, J., and S. Harrison. 2005. Management Objectives and Economic Value of National Parks: Preservation, Conservation and Development. Discussion Paper No. 337. Queensland, Australia: School of Economics.
Tricker, J., P. Landres, J. Chenoweth, R. Hoffman, and S. Ruth. 2013. Mapping Wilderness Character in Olympic National Park. Final Report. Missoula, MT: USDA Forest Service, Rocky Mountain Research Station, Aldo Leopold Wilderness Research Institute.